Java Reference
In-Depth Information
BarChart.Data {category: categories[1] value: 4.7}
]
},
... // omitted full list of data series
];
// put bar on stage for display
Stage {
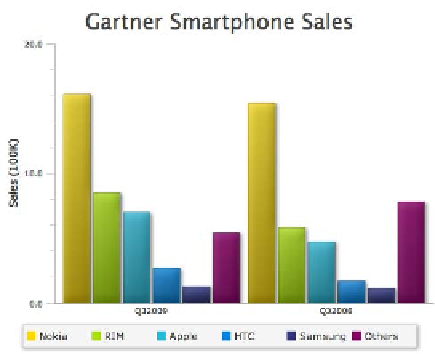
title: "Gartner Smartphone Sales"
scene: Scene {
content: [
BarChart
{
title: "Gartner Smartphone Sales"
titleFont: Font { size: 24 }
categoryAxis:CategoryAxis {
categories: categories
}
valueAxis:NumberAxis{
label:"Sales (100K)"
upperBound:20
lowerBound:0
}
data
: bind
dataSeries
}
]
}
}
When the code is executed, it produces the bar chart shown in the next figure: