Geology Reference
In-Depth Information
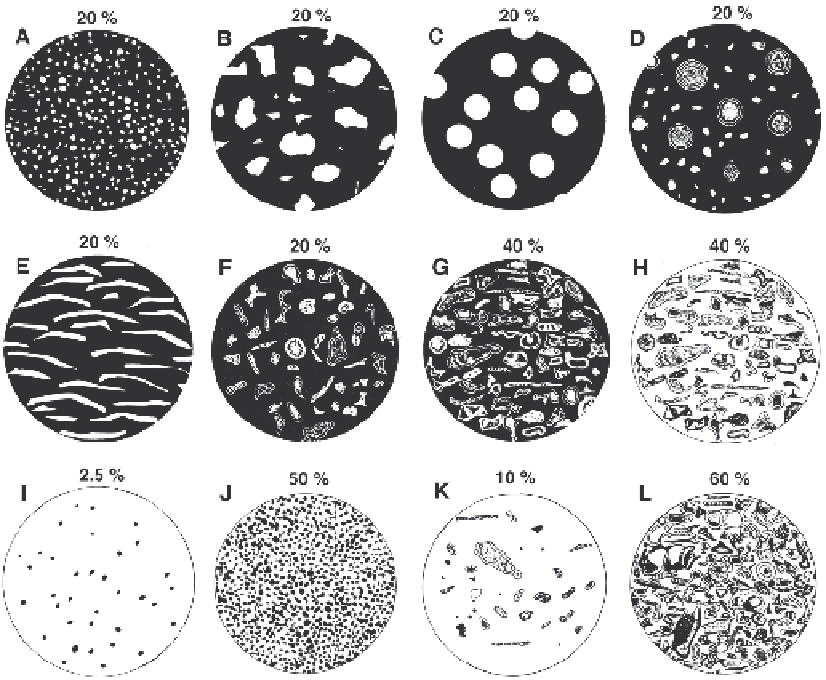
Fig. 6.10.
Examples from the 'Comparison charts for visual percentage estimation' developed for limestones by Baccelle
and Bosellini (1965).
The entire series of 24 charts can be found on the CD.
The charts compare (a) different grain catego-
ries,
(b) different percentage values
and (c) the psychological distortion effects which result from looking at white objects
on a black or gray background and black objects on a white or gray background. The major
grain categories
are shown in the
images A to F:
A
- silt-sized and fine-sand sized particles, e.g. peloids, small intraclasts, or microfossils;
B
- coarse angular
and subangular particles, e.g. intraclasts and angular skeletal grains;
C
- equal-sized ooids;
D
- differently sized ooids or
oncoids associated with smaller particles, e.g. peloids;
E
- oriented shells, e.g. bivalves;
F
- associations of various grains,
here predominantly bioclasts, a few coated grains and peloids.
White/black effect:
Contrasting particles appear larger or
smaller depending on the background; G and
H
display the same percentage of skeletal grains with a black and with a white
background.
Low and high
values
: Most charts start with images at 10%; only the charts for the groups A and B show images
below 10%. The largest percentage value shown is 50 or 60%.
I
and
J
: Few and abundant peloids contrasted;
K
and
L
: Few
and abundant bioclasts.
These results derived for oolitic and bioclastic grain-
stone samples, however, should not be overrated, be-
cause the questions raised in the exercise were rather
simple and concerned only the amount of the total of
all grains without any differentiation of grain types. Less
favorable results were produced by experiments deal-
ing with texturally inhomogeneous limestones and ask-
ing for estimates of the frequency of particular grain
types occurring in highly variable abundances. Rare
and less common grains were considerably under- and
overrated. In addition, the error increased with decreas-
ing grain size. Very small grains, e.g. some foramin-
ifera or sponge spicula, occurring in low percentages
(2 to 10% according to point-counting measurements)
were commonly excluded both in free-lance estimates
and in the estimates using comparison charts. The com-
positional variability of these samples was revealed only
by areal counting and point counting. Another pitfall
of estimating methods is that thin-section diversity is
often blurred because of the missing data of low-per-
centage biota.
In summary, estimating methods have their merits
if two-state compositions are being analyzed (e.g. grain/
matrix ratio or amount of visible porosity), or if only
the relative frequency of two or three different grain
categories is being sought. Constituent analyses, how-
ever, commonly based on all available thin-section data
need counting data that allow point-counter groups to
be treated statistically (Sect. 6.3).