Geology Reference
In-Depth Information
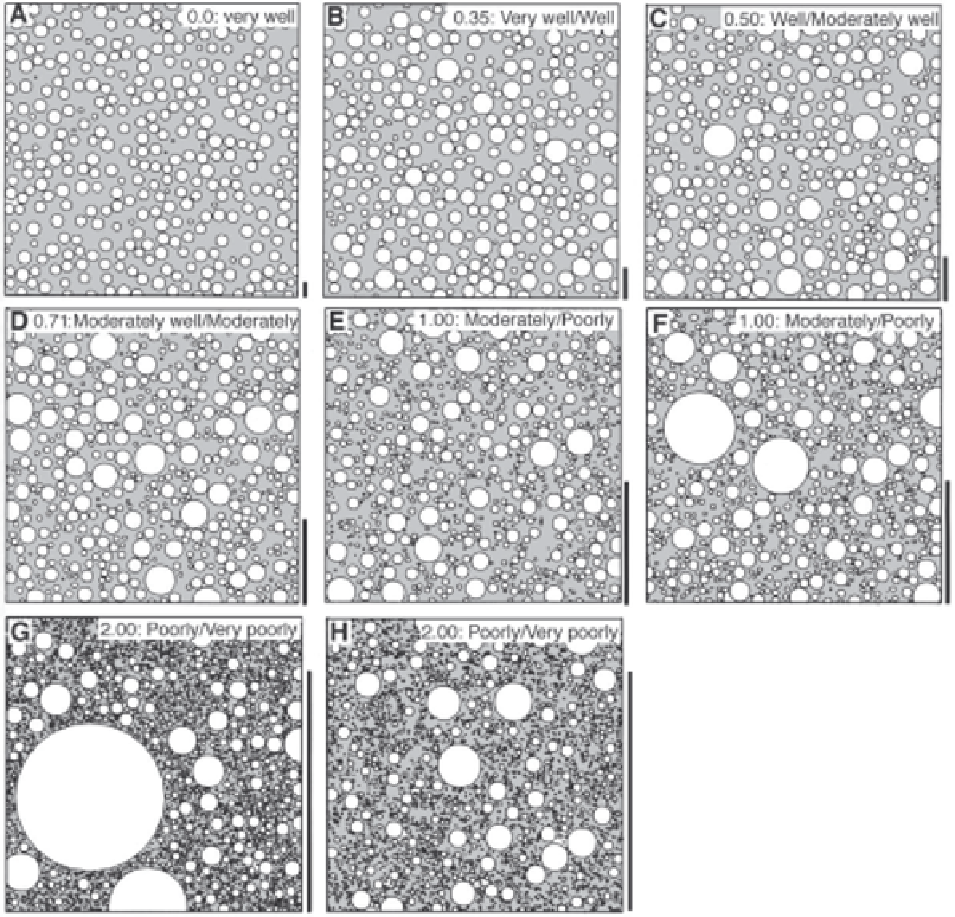
Fig. 6.3.
Comparison charts for particle sorting after Longiaru (1987)
. Labels indicate the degree of sorting (standard
deviation) approximated by the comparator and the descriptive terminology of Folk (1966). Visual estimates of sorting can
be obtained by comparison with charts, some of which have been developed particularly for calcarenites (e.g. Harrell 1984).
Note that visual comparison charts assume a lognormal distribution of grains, which is not always the case, and that in most
charts larger grains are overrepresented except in the charts shown in this figure. The bar at the lower right of each diagram
indicates the maximum grain size which might occur in the samples.
6.1.1.2 Approaches to the Environmental
Interpretation of GrainSize Data
beach and dune sands (Friedman 1979; Eschner and
Kirchner 1984; El-Ella and Coleman 1985; Sutherland
and Lee 1994). The
Friedman diagrams
allow the plots
to be differentiated into major environmental fields.
Passega (1957, 1964. 1977) suggested that the ratio
of the coarsest one percentile, C, to the median dia-
meter, M, and the percentage of grains finer than 31
m
(L) are indicators of the dynamics in different deposi-
tional environments. The strongest current should de-
fine the largest stable particle size. Different fields in
Hydrodynamically controlled covariations of two or
more measures, such as mean size and sorting are com-
monly available. Following early studies by Friedman
(1961, 1967) and Douglas (1968) the use of bivariate
scatter diagrams
(e.g. skewness vs. standard deviation
or mean size vs. standard deviation) has become a com-
mon approach in attempts to discriminate modern river,