Biomedical Engineering Reference
In-Depth Information
Broadband
light source
1x2
Coupler
2x2
Coupler
Isolator
PC
CND
G
DM
L
PC
M
D1
D2
Diff. amplifier
filter
demodulator
Probe
Sample
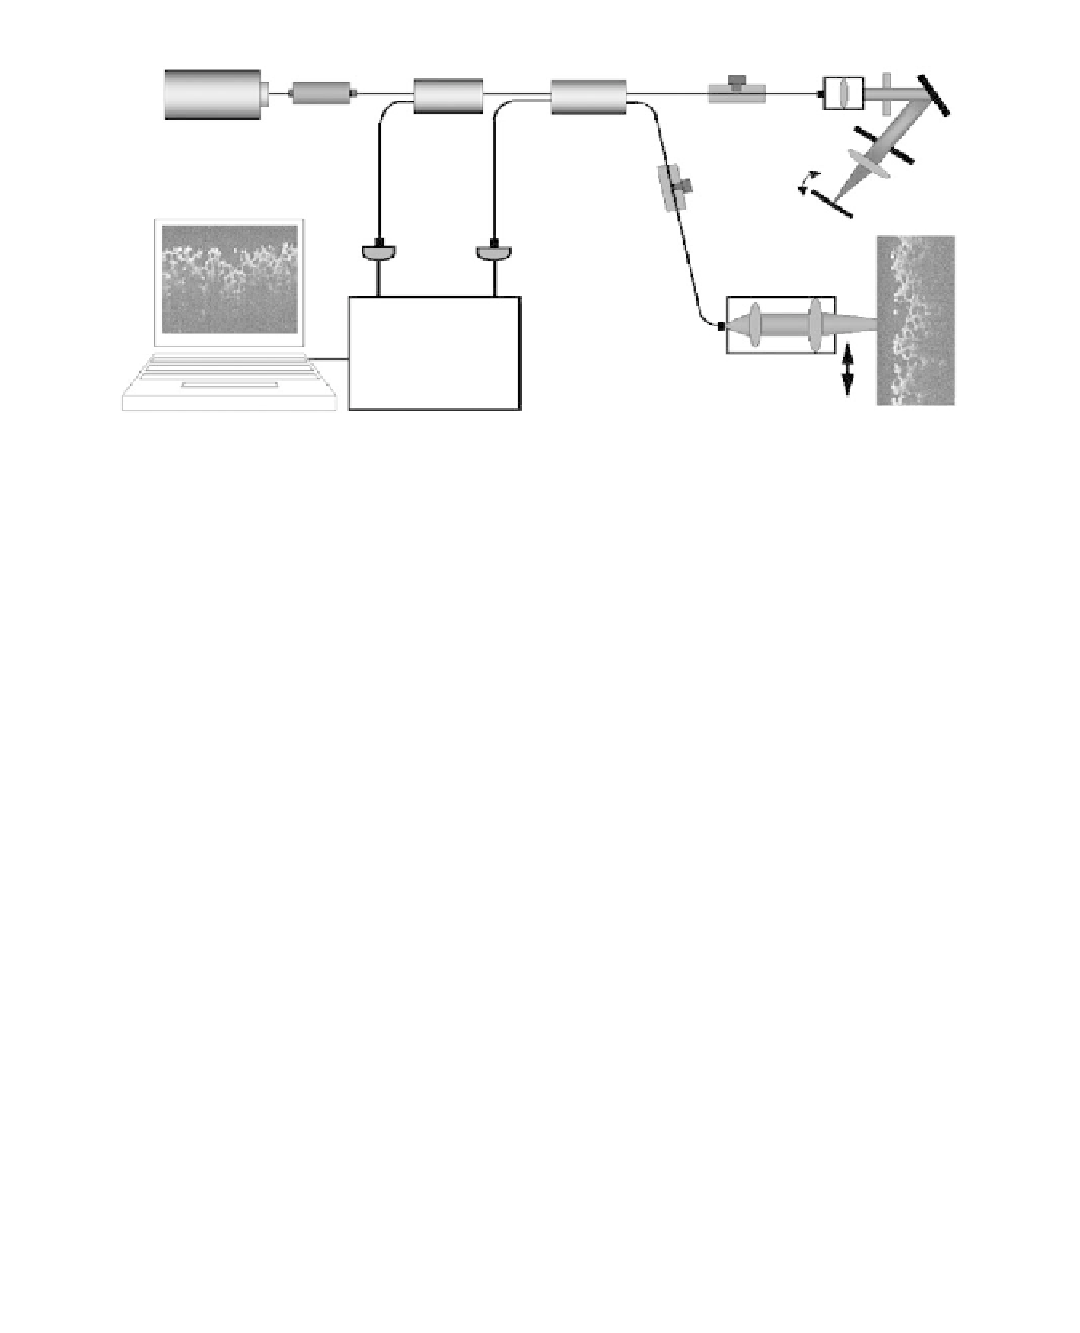
FIGURE 3.6
Schematic representation of OCT system setups used for the current investigations, where
PC denotes the polarization controller, C the collimator, ND the neutral density fi lter, G the grating, DM the
double pass mirror, L the optical lens, M the refl ecting mirror and D the detector.
145
The pore size in the PLLA scaffold made by single porogen was controlled between 255 and
350 µm, yielding a porosity of approximately 90% by the weight fraction of PLLA and salt in the scaf-
folds. When the salt crystal size is altered while maintaining the polymer/salt weight ratio, the resultant
scaffolds have different pore sizes but a similar porosity. Figure 3.7a gives an example of the resulting
OCT images from such scaffolds where an imaging depth of around 1 mm was achieved despite the
highly scattering nature of the scaffold. The top view image of the same scaffold from reconstruction
(Figure 3.7b) clearly presented the porous structure. The imaging contrast was primarily provided by
the difference in scattering coeffi cient among the polymer, PLLA, and PBS in which the measure-
ments were performed. The polymer backscattered the light, thereby appearing brighter, while the
pores appear as a dark area in the OCT image. Such contrast gives us an opportunity to estimate the
porosity from the OCT images. By using a commercial software, for example, Volocity, Improvision,
the porosity has been derived as 70%, which was close to the value estimated by stoichiometry.
Figure 3.8a shows the scaffold produced by dual porogen, NaCl and naphthalene, in comparison
with the same pore-size scaffold made by a single porogen, NaCl (Figure 3.8b). The corresponding
cross-section images are presented in Figure 3.9. Striking morphological changes can be seen when
compared with Figure 3.7a. First, the pore size in these scaffolds was smaller since 106-255 µm.
NaCl porogen was used in these scaffolds, demonstrating that OCT image can clearly distinguish
pore size variations in these scaffolds. Secondly, pore interconnection has been obviously increased
in the dual porogen-produced scaffolds. Introducing naphthalene as the second porogen in solvent-
casting and salt-leaching process resulted in the improvement of the pore interconnectivity. By
using 20% naphthalene, highly interconnected pore structures were achieved. This interconnection
feature has been further confi rmed by SEM analysis.
146
SEM images of the scaffolds prepared with
and without naphthalene are given in Figure 3.10. Extra-small pores presented in the pore wall were
visualized in the scaffolds produced with naphthalene. Figure 3.11 is a typical OCT image of porous
chitosan scaffolds with microchannels. The porous structure was clearly seen and the channels were
well-delimitated. The interconnected micropores have diameters ranging from 50 to 150 µm, while
the microchannels have a width of 250 µm. The typical image of the specimens shows a penetration
depth of more than 1 mm. On the other hand, the fi brous chitosan scaffolds exhibited a character-
ized morphology in OCT image. The diameter of the fi bers was very clearly delimitated, allowing
the examination of the distribution of the fi bers inside the scaffold (Figure 3.12).