Biomedical Engineering Reference
In-Depth Information
infl uenced by the substrate bias. The higher the bias
V
b
, the larger is the activation of the adherent
platelets. This trend is consistent with the surface energy of the fi lms. The effects can be attributed
to the preference of albumin adsorption due to the higher
W
a
value of albumin that can be compared
to that of fi brinogen and the changes of fi brinogen conformation, which has been caused by higher
interfacial energy
γ
sp
. The blood compatibility of the a-C:H fi lm deposited at
-
75 V is better than
that exhibited by stainless steel and similar to that of LTI-carbon.
19.5.1.3 Infl uence of Annealing Temperature on Electrical
Property and Blood Behaviors
Hydrogenated amorphous carbon fi lms have been fabricated at room temperature using
PIIID. After PIIID, annealing was carried out at 200-600°C for 30 min at reduced pressure
(
10
-
3
Pa).
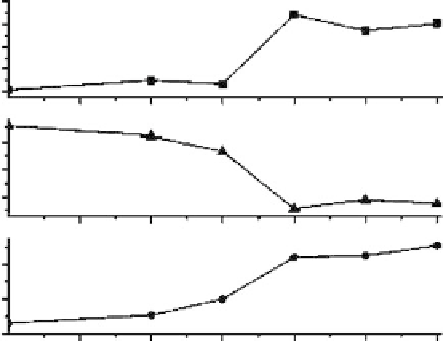
The position and width of the G-peak and
I
D
/I
G
ratio as a function of the annealing tempera-
ture are shown in Figure 19.38. The shift in the G-band indicates the increase in size and number
of the sp
2
carbons, and the increase in the observed
I
D
/I
G
intensity ratio suggests that there is an
increase in the number of ordered aromatic rings within the samples. The emergence of the D-band
and the increase of the
I
D
/I
G
ratio show that the materials have become nanocrystalline graphite
[161]. The steep changes observed in the three curves at 300-400°C indicate that graphitization is
promoted at higher annealing temperature arising from a diffusive mechanism. Ogwu has reported
similar results [162].
The dependence of
E
g
, resistivity, and carrier concentration on annealing temperature is shown
in Figure 19.39. As the band gap depends on the confi guration of the sp
2
sites, the growth of the sp
2
cluster with increasing annealing temperature is the main reason for the observed band gap narrow-
ing [164]. Both the resistivity and Hall mobility decrease with increasing annealing temperature and
the trends are consistent with the Raman shift in the G-line. The steep changes at approximately
400°C in the two curves also agree with the Raman results. Thus, it appears that the increase of the
electrical conductivity in the annealed a-C:H fi lm is related to an increase in the sp
2
bonding carbon
and ordered sp
2
cluster caused by graphitization.
<
1
×
3.2
3.0
2.8
2.6
2.4
110
100
90
1580
1570
1560
100
200
300
400
500
600
Annealing temperature (
°
C)
FIGURE 19.38
Intensity ratios of the D-band to G-band and width and position of G-band with annealing
temperature derived from Raman spectra. (From Yang, P. et al.,
Surf. Coating Tech
., 177-178, 747, 20 0 4. Wit h
permission.)