Biomedical Engineering Reference
In-Depth Information
account the Raman results shown in Figure 19.6 which illustrates that the shift of both the G- and
D-peaks is the biggest and the FWHM of the G-band peak is largest at a
F
C
2
H
2
/
F
Ar
fl ow ratio of 1.2,
it can be inferred that the blood compatibility of the DLC fi lm is infl uenced by the sp
3
to sp
2
ratio,
not by the absolute sp
3
content or sp
2
content, and the hemocompatibility becomes worse when the
sp
3
to sp
2
ratio increases.
19.5.1.2 Infl uence of Bias Voltage on Surface Property and Platelets Adhesion
Hydrogenated amorphous carbon fi lms have been fabricated at room temperature. A mixture of
acetylene (C
2
H
2
) and argon was introduced into the chamber and the plasma was triggered using
RF. Film deposition was carried out at a constant RF power of 500 W. During the initial deposition
of the base fi lm, a higher negative DC bias voltage was applied to the sample holder to improve fi lm
adhesion by means of ion mixing. A series of DLC fi lms were synthesized by adjusting the substrate
bias voltage in subsequent deposition of the top fi lms.
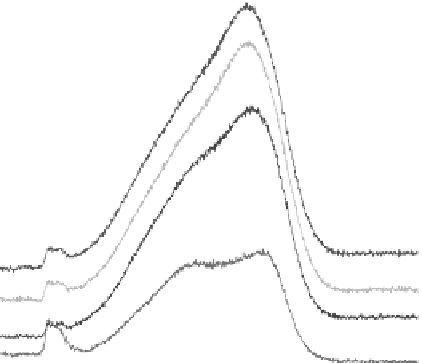
The Raman spectra acquired from the hydrogenated DLC (a-C
H) fi lms prepared under
different bias voltages are exhibited in Figure 19.34. A higher bias voltage (
V
b
) leads to the shift of
the two peaks toward higher wave numbers and increasing
I
D
/
I
G
ratios. The positions of the G- and
D-lines, G-full WHM and integrated intensity ratio (
I
D
/
I
G
) can be correlated with the sp
3
/sp
2
bonding
ratio [153], graphite cluster size [154,155], and disorder in these threefold coordinated islands [156].
Hence, the sp
3
/sp
2
ratios in the a-C:H fi lms cannot be derived directly from the Raman spectra, but
nevertheless, some qualitative information can be extracted. Increases in the
I
D
/
I
G
ratio, shifting of
the G-peak toward higher wave numbers, widening of the D-peak, and narrowing of the G-peak
are caused by increase of the graphite-like component in the amorphous carbon fi lms [157]. The
results indicate that the fi lm structure becomes more graphite-like with increasing substrate bias.
One of the reasons is that the increase in substrate temperature induced by higher energetic ion
-
a-C:H-1
−
75 V
a-C:H-2
150 V
−
a-C:H-3
−
300 V
a-C:H-4
−
900 V
Graphite
800
1000
1200
1400
1600
1800
2000
2200
Raman shift (cm
−
1
)
FIGURE 19.34
Raman spectra of the a-C:H fi lms fabricated at different bias voltages. (From Yang, P. et al.,
Biomaterials
, 24, 2821, 2003. With permission.)