Biomedical Engineering Reference
In-Depth Information
RF system
C
2
H
2
gas
inlet
Vacuum
chamber
Antenna
Silicon
substrate
Acetylene,
phosphorus and
calcium plasma
Calcium powder
Phosphorus
powder
To pump
−
VE pulse bias
FIGURE 19.30
Schematic diagram of PIIID to deposit Ca, Ca and P, and P-doped DLC fi lms.
(a)
(b)
0.2
0.2
0.4
0.4
0.6
0.6
X 0.200
µ
m/div
Z 5.000 nm/div
X 0.200
µ
m/div
Z 5.000 nm/div
0.8
0.8
µ
m
µ
m
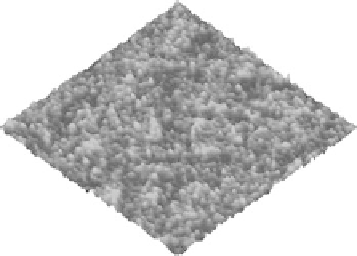
FIGURE 19.31
AFM micrographs of the DLC fi lms prepared by PIIID at
F
C
2
H
2
/
F
Ar
ratios of (a) 0.6 and
(b) 1.2. (From Chen, J.Y. et al.,
Surf. Coating Tech.
, 156, 289, 2002. With permission.)
are relatively smooth, but a higher
F
C
2
H
2
/
F
Ar
fl ow ratio gives rise to a rougher surface, and it is due to
the difference in the sp
3
content. The Raman spectra acquired from the DLC fi lms prepared at dif-
ferent
F
C
2
H
2
/
F
Ar
fl ow ratios are shown in Figure 19.32. All the Raman spectra show a relatively sharp
peak at around 1550/cm
−
1
and a shoulder at around 1345cm
-
1
, commonly referred to as the G-band and
D-band, respectively. The latter becomes a shoulder of the former because the fi lm is hydrogenated.
It is found that the shifts of both the G- and D-peaks are the biggest and the G-peak width (full width
half maximum [FWHM]) is the largest at a
F
C
2
H
2
/
F
Ar
fl ow ratio of 1.2. The changes in the Raman