Biomedical Engineering Reference
In-Depth Information
(a)
(b)
(c)
(d)
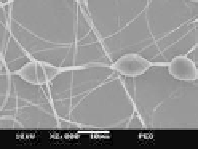
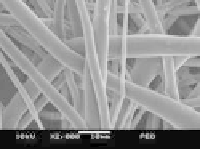
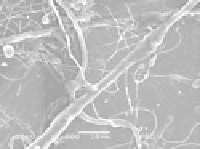
FIGURE 5.6
Electrospun bovine type I collagen with different concentrations: (a) 5% w/v, (b) 8% w/v,
(c) 10% w/v, and (d) 15% w/v. Electrospinning voltage, fl ow rate, and distance were kept at 10 kV, 0.75 mL/h,
and 12 cm, respectively. Below 8% concentration, the electrospun fi bers were deposited wet while above 10%,
formation of submicron-sized fi bers was extremely diffi cult due to high viscosity.
(a)
Electrospun PEO fibers with 10 kV, 15 cm distance, 0.75 mL/h flow
10% w/v
15% w/v
20% w/v
25% w/v
(b)
Electrospun PEO fibers with
10 kV, 15 cm distance, 17.5% w/v concentration
−
0.5 mL/h
1.5 mL/h
1.0 mL/h
2.0 mL/h
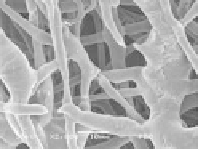
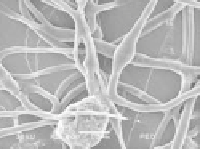
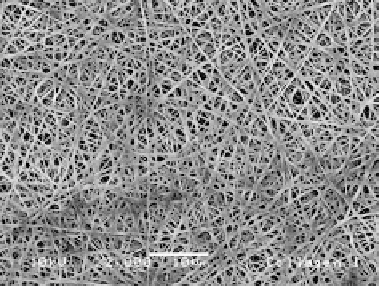
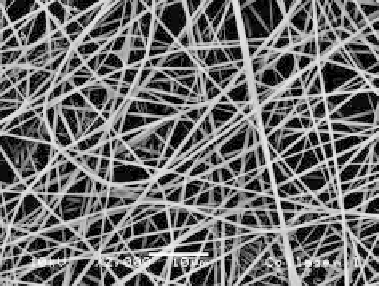
FIGURE 5.7
Electrospun PEO nanofi bers obtained with varying parameters. (a) PEO solution concentration
affects the fi nal fi ber morphology. At lower concentration, beading is more prominent than fi bers whereas
increasing the concentration results in more uniform and thicker fi bers. (b) Variation in morphology due to
changes in material fl ow rate to the capillary. At low material transfer rate, breakages in the fi bers occurred
while a faster transfer rate allows continuous fi ber to be drawn.