Biology Reference
In-Depth Information
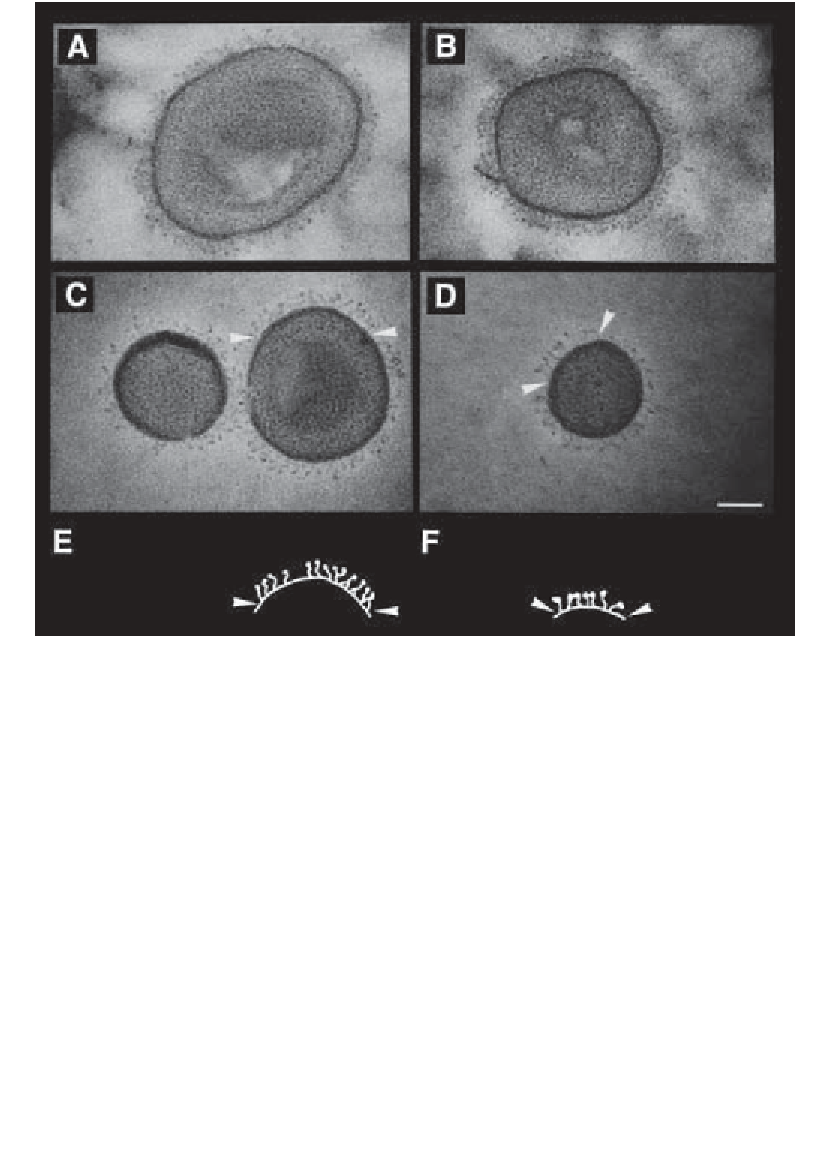
3 incorporated
into DMPC/DMPG vesicles.
A
and
B
: vesicles with high surface density of the integrin
α
Fig. 1. Negatively stained electron micrographs of integrin
α
IIb
β
3. The bar represents
100 nm. Schematic drawings of selected regions in
C
and
D
represent the integrin
organization within the membranes of vesicles (
E
and
F
).
IIb
β
3,
C
and
D
: with low surface density of the integrin
α
IIb
β
Several methods for the reconstitution of integrins into phospholipid vesicles
are described
(8-10).
Müller et al
. (10)
were the first to use the method of
detergent removal by BIO-Beads
(11)
to reconstitute integrin
3. It is
important to analyze the vesicles after the reconstitution by electron micros-
copy in addition to the quantification of protein
(12)
and lipid
(13)
to distin-
guish between real protein incorporation into the vesicles or protein attachment
to the vesicle surface. Electron micrographs of negatively stained specimen
show integrin incorporation into phospholipid vesicles at different receptor
densities (
Fig. 1A-D
). At a lower integrin density, well-separated integrin
molecules can clearly be distinguished, indicating a nonclustered mono-
dispersed distribution of the integrin.
Figure 2A
shows the schematic drawing
α
IIIb
β
Search WWH ::

Custom Search