Geology Reference
In-Depth Information
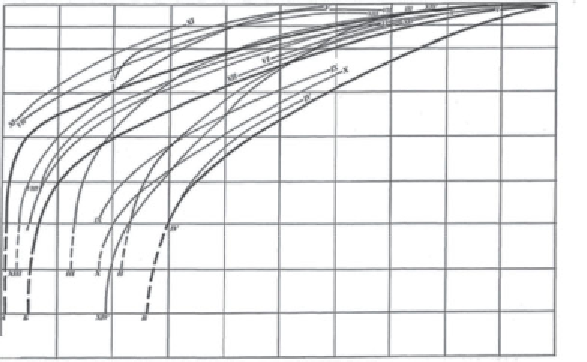
Porosity, %
0
2
4
6
8
10
12
14
16
18
20
22
24
26
28
30
32
34
36
38
40
42
44
500
1000
2000
3000
4000
5000
6000
7000
H,
m
Figure 5.6
Total clay porosity vs. burial depth.
Classical patterns
: A. Weller curve
(1959); B. Vassoyevich curve (1960); C. Rachinsky-Durmishyan curve (1983).
Regional correlations
: South-Caspian Basin - I. Central Apsheron; II. Baku Archipelago;
III. SW Turkmenistan; Azov-Kuban region - IV. South flank, West Kuban Trough;
V. Adygey Salient; VI. Scythian Plate; VII. Novoselov High (Crimea); VIII. Crimean plain;
Middle-Caspian region - IX. Sunzha zone of the Tersk-Caspian Trough; X. Tersk zone
of the Tersk-Caspian Trough; XI. Piedmont Dagestan; XII. Stavropol Arch; Maracaibo
Basin - XIII. Venezuela, Columbia. Gulf of Mexico Basin - Gulf Coast.
occurred at the end of Miocene and during Quaternary time, the shale
porosity at the present-day elevations corresponds to the pre-existing
depths of their burial (Durmishyan and Rachinsky, 1976; Rachinsky,
1983).
Analysis of the above-described compaction curves leads to the follow-
ing conclusions:
1. There is no unique porosity vs. depth correlation curve for
all formations. Each region, area, formation and section
has its distinct clay compactional environment and correla-
tion curve. The shape and position of the correlation curve
depend on the lithology, thickness, sratigraphic age and geo-
logic evolution.
2. The pore water outflow during the sedimentation and
diagenesis of thick clay sequences is severely restricted.
This results in a lag between the fluid emigration rate and