Geology Reference
In-Depth Information
40
60
80
100
120
140
160
180
200 220
240
260
280
t
, °C
0
2
4
6
8
10
12
14
16
18
H
, km
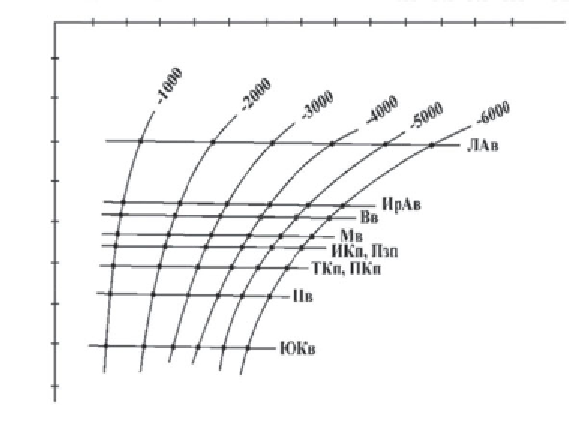
6,000) m vs. sediment cover thickness
(depth to basement). See Figure 3.8 for the symbols.
Figure 4.2
Temperature at subcrops (
−
1,000) to (
−
(
6,000) m correspond
with miogeosynclinal regions with maximum recent compensational depo-
sition rates and sediment cover thicknesses (the South Caspian and Padan
Depressions, Zagros Trough). On the other hand, the highest temperatures
belong to the regions with mostly eugeosynclinal evolution features and rel-
atively small sediment fill thicknesses (Los Angeles, Viennese, Maracaibo,
Irrawaddy-Andaman Depressions).
The differentiation between regions in the indicated geotectonic attri-
bute is causally associated with the elevated heat activity in the eugeosyn-
clinal zones caused mostly by thermal effects of the Cenozoic and recent
volcanism (Polyak, 1966; Explanatory note …, 1980; Smirnov, 1972).
It is believed that the temperature correlation at subcrops with the thick-
ness of the stratosphere is indirect. It may be interpreted as a result of heat
field distortion progressing with the growth in the deposition rate caused by
hysteresis in the deposits' conductive heating relative to their accumulation
(heating of sedimentary rocks by the upcoming heat flow lags behind their
subsidence). This effect is determined by nonstationary geothermal field dis-
tribution in the regions of intense recent subsidence and causes heat flow
(therefore, temperature) distortion, a 15-20% decrease compared with sta-
tionary conditions (Explanatory note …, 1980; Smirnov, 1972; Yeremenko,
1984).
1,000), (
2,000), (
3,000), (
4,000), (
5,000) and (
−
−
−
−
−
−