Biology Reference
In-Depth Information
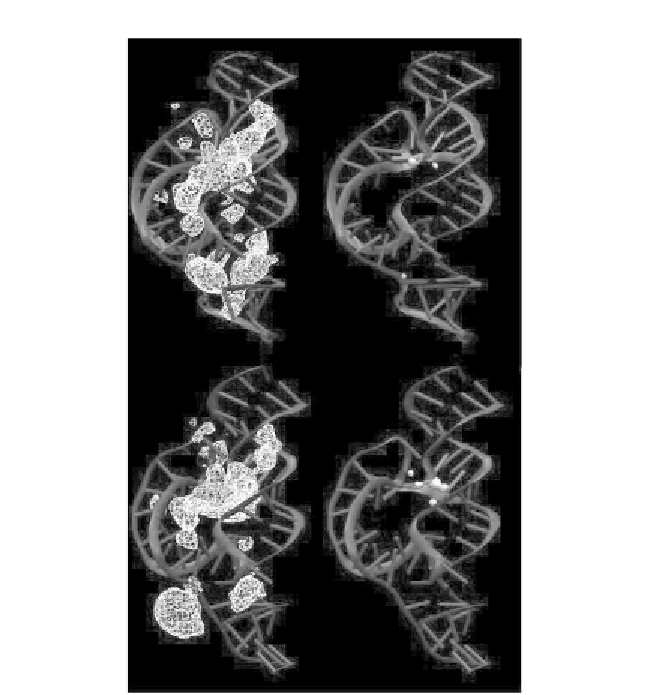
Figure 2.9 The 3D density contour maps (white) of Na
þ
ion distributions derived from
the RT-Na (upper panels) and dRT-Na simulations (low panels) at different isodensity
contour levels (left panels: 0.1; right panels: 1.0). The HHR is shown in dark gray. The
figure shows that, although the Na
þ
ions distribute around the RNA phosphate back-
bone (left panels), the HHR folds to form a local electronegative recruiting pocket that
attracts a highly condensed distribution of the Na
þ
ions (left panels) both in the reactant
state and the deprotonated activated precursor state (deprotonated C17:O2
0
)
simulations.
4.2. Discussion
Our simulations suggest that in order to maintain the active in-line confor-
mation, the highly negative charged environment of the active site needs to
be balanced by a threshold cation occupancy. This can be accommodated in
the reactant state by either a single Mg
2
þ
ion, or one to two Na
þ
ions. In the
Search WWH ::

Custom Search