Hardware Reference
In-Depth Information
DataAnalysis
After loading this code on to your Arduino, set it up at your door and let it run
for a while. When satisfied with the amount of data you have collected, put the
SD card in your computer and load the CSV file with your favorite spreadsheet
program. Assuming that you only logged over the course of one day, you can
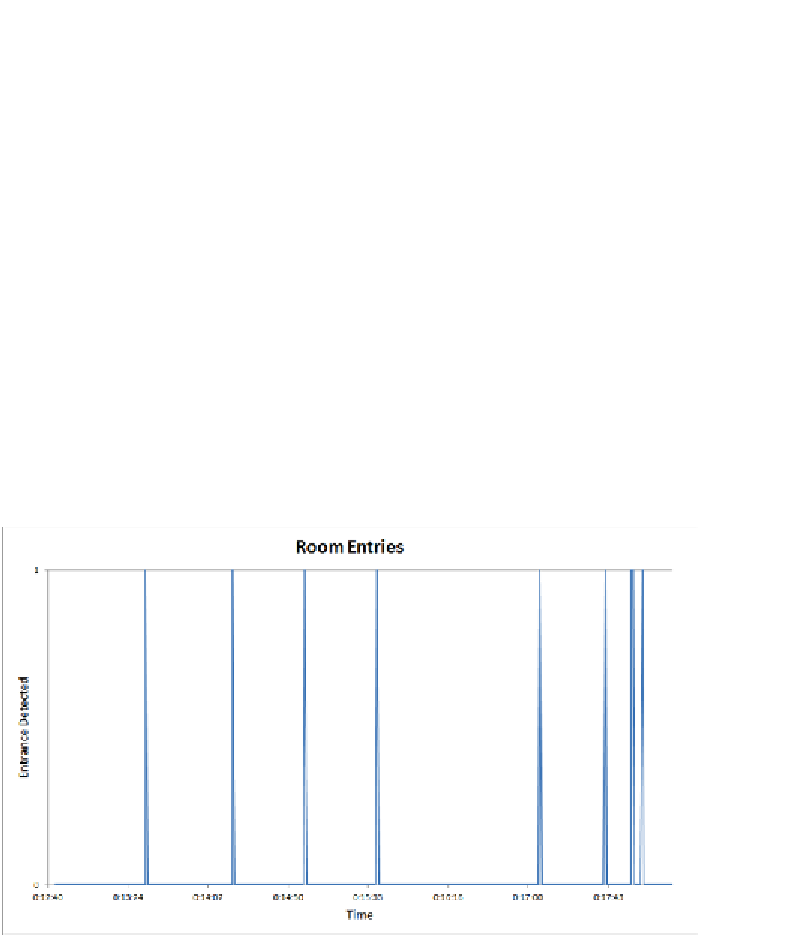
now plot the time column against the activity column. Whenever there is no
activity, the activity line graph remains at zero. Whenever somebody enters or
exits the room, it jumps up to one, and you can see exactly when it happened.
The procedure for creating a plot will vary with different graphing applica-
tions. To make it easy for you, I've created a preformatted online spreadsheet
that will do the plotting for you. You must have a Google account to use it.
Visit the web page for this chapter (
www.exploringarduino.com/content/ch13
)
and follow the link to the graph-generation spreadsheet. It will prompt you to
create a new spreadsheet in your Google Drive account. Once this completes,
just copy your data in place of where the template data is, and the graph will
update for you automatically. Figure 13-24 shows what a graph of data over a
few minutes might look like.
Figure 13-24:
Entrance logger data graphed over several minutes
Search WWH ::

Custom Search