Geology Reference
In-Depth Information
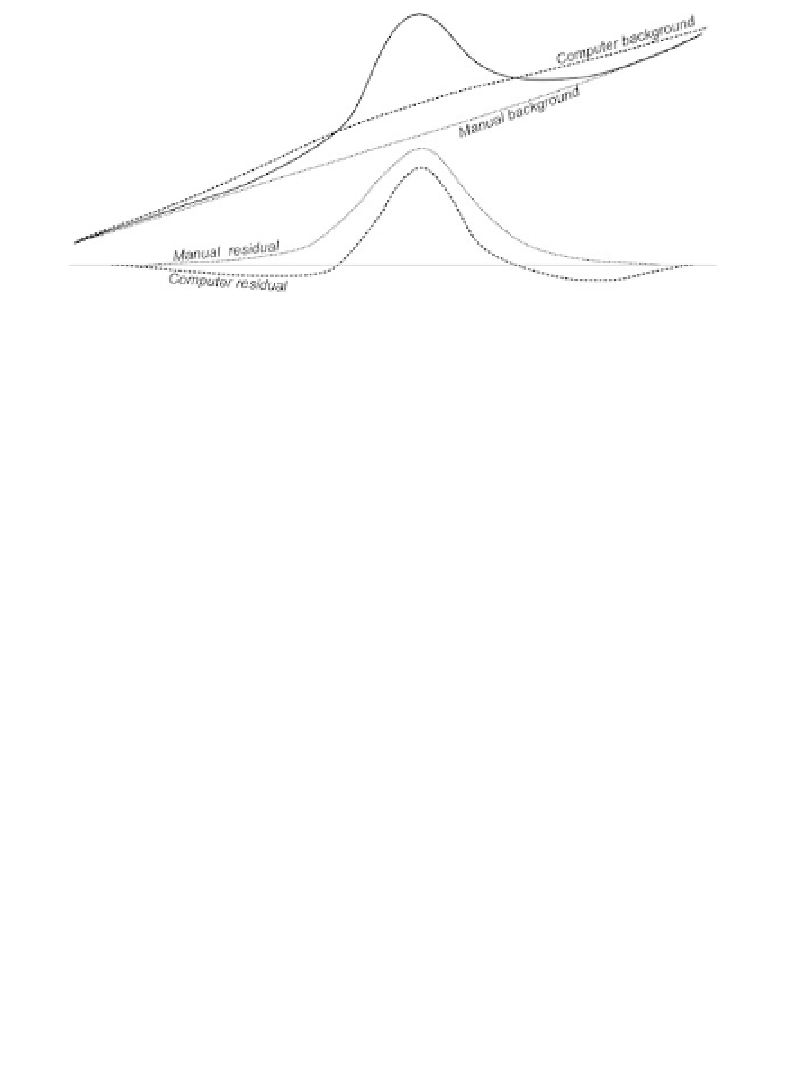
Figure 1.11
Computer and manual residuals. The background field drawn
by eye recognises the separation between regional and local anomaly, and
the corresponding residual anomaly is probably a good approximation to
the actual effect of the local source. The computer-drawn background field is
biased by the presence of the local anomaly, and the corresponding residual
anomaly is therefore flanked by troughs.
1.5.10 Presentation of results
The results of surveys along traverse lines can be presented in profile form,
as in Figure 1.10. It is usually possible to plot profiles in the field, or at
least each evening, as work progresses, and such plots are vital for quality
control. Most field crews now carry laptop computers, which can reduce the
work involved, and many modern instruments and data loggers will display
profiles in real time as work proceeds.
A traverse line plotted on a topographic map can be used as the baseline
for a geophysical profile. This type of presentation is particularly helpful
in identifying anomalies due to man-made features, since correlations with
features such as roads and field boundaries are obvious. If profiles along a
number of parallel traverses are plotted in this way on a single map they are
said to be
stacked
, a word otherwise used for the addition of multiple data
sets to form a single output set (see Section 1.5.7).
Contour maps used to be drawn in the field only if the strike of some
feature had to be defined quickly so that infill work could be planned, but
the routine use of laptop computers has vastly reduced the work involved.
Information is, however, lost in contouring because it is not generally pos-
sible to choose a contour interval that faithfully records all the features of
the original data. Also, contour lines are drawn in the areas between tra-
verses, where there are no data, and inevitably introduce a form of noise.
Examination of contour patterns is not, therefore, the complete answer to