Geology Reference
In-Depth Information
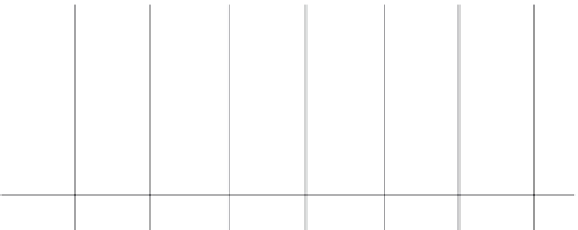
Dispersion curve showing picks and fit
3000
Calculated dispersion
Picked dispersion
2000
1000
0
0.00
0.02
0.04
0.06
0.08
0.10
0.12
0.14
Period (secs)
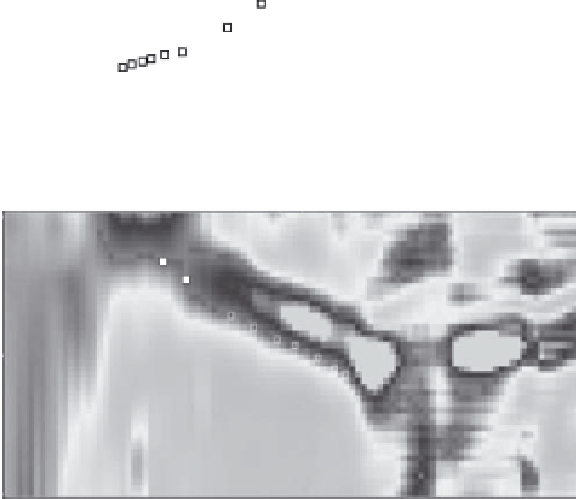
Slowness-frequency image with dispersion modelling picks
Frequency (Hz)
Figure 14.5
Example of (ReMi) wavefield transformation to a slowness-
frequency dispersion image (bottom) with dispersion picks tracing a disper-
sion curve along the leading edge of the Rayleigh wave fundamental mode.
The modelled dispersion curve is also shown (top).
energy, and picking is done along a lowest velocity envelope bounding the
Rayleigh wave fundamental (Figure 14.5). The p-tau slowness-frequency
dispersion image takes into account waves travelling in different directions.
The MASW f-k approach is more sensitive to direction, but 2D receiver
arrays can go a long way towards dealing with this. MASW dispersion
curves are picked on the spectral peak of the Rayleigh wave fundamental.