Geoscience Reference
In-Depth Information
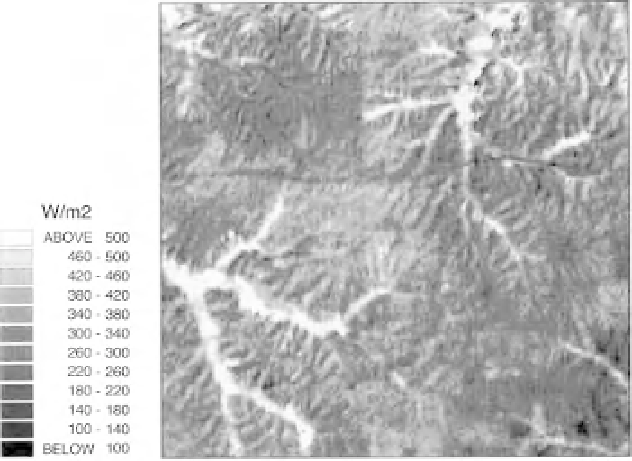
Figure 3.6
Predicted spatial pattern of actual evapotranspiration based on remote sensing of surface tempera-
tures; note that these are best estimates of the evapotranspiration rate at the time of the image; the estimates are
associated with significant uncertainty (after Franks and Beven, 1997b, with kind permission of the American
Geophysical Union).
have the capability of measuring water levels with a resolution of 100 m to an accuracy of the order of
0.1 m and a slope accuracy of 1 cm/km over 90% of the globe and a maximum repeat time of 22 days.
This will still be most useful in larger rivers with seasonal changes in discharges but has the potential to
improve modelling of flood waves in those rivers.
There have also been some advances in the use of remote sensing for the estimation of spatial patterns
of evapotranspiration. Studies such as those of Holwill and Stewart (1992), Bastiaanssen
et al.
(1994,
1998), Xinmei
et al.
(1995), Franks and Beven (1997b), Su (2002), Calcagno
et al.
(2007), Sch uttemeyer
et al.
(2007) and Kalma
et al.
(2008) have used single and multiple images of remotely sensed sur-
face temperatures with simple energy balance modelling to separate sensible and latent heat fluxes to
calculate patterns of actual evapotranspiration flux (Figure 3.6). The patterns have, in every case, re-
vealed significant and interesting heterogeneity in fluxes, but error calculations suggest that the absolute
values of the calculations may be subject to large uncertainty (Franks and Beven, 1997b; see also,
Kalma
et al.
, 2008).
3.10 Tracer Data for Understanding Catchment Responses
The use of tracer information to improve understanding of catchment responses goes back to the late
1960s and 1970s when the pioneering studies of Dincer
et al.
(1970) on snowmelt and Pinder and Jones
(1969), Crouzet
et al.
(1970) and Sklash and Farvolden (1979) on rainfall-runoff processes first started
to reveal the extent to which the hydrograph is made up of pre-event or “old” water stored in a catchment
prior to a hydrograph-producing event (see Section 1.4). Since then, a variety of environmental and artifi-
cial tracer techniques have been used in such studies. Artificial tracers are generally limited to profile and
plot scale experiments (for example, the multiple tracer experiments of Abdulkabir
et al.
, 1996) since it