Geoscience Reference
In-Depth Information
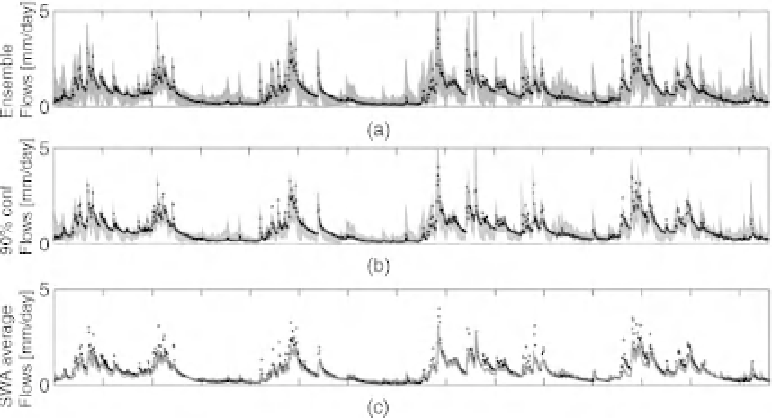
Figure 10.1
Hydrograph predictions using the PDM model and parameters estimated by the ensemble
method: (a) the 10 best parameter sets from the 10 most similar catchments; (b) 90th percentile of the
same ensemble; (c) similarity weighted ensemble (after McIntyre et al., 2005, with kind permission of the
American Geophysical Union).
ungauged site of interest rather than the available gauged sites. Thus, for a new ungauged site, a group
of gauged catchments is sought that are close in characteristics to that site; its “nearest neighbours” in
terms of whatever measures are being used to assess similarity.
But we should expect the estimates of rainfall-runoff model parameters for the pooling group donor
sites to be uncertain, and the transfer of information from those sites to the ungauged site should add
to that uncertainty. McIntyre
et al.
(2005) have attempted to take these uncertainties into account by
allowing for uncertainty in estimating parameter sets for the PDM model (Section 6.2) for the gauged
catchments using the GLUE method of Section 7.10, then weighting the parameter sets from donor
catchments according to similarity with respect to physical characteristics. Similarity was defined rather
simply in this case in terms of the Euclidean distance in the space of the catchment area, standard annual
average rainfall (SAAR) and an estimated baseflow index based on the fraction of HOST soil types in the
catchment, as used in the
Flood Estimation Handbook
(IH, 1999). Log transforms of area and SAARwere
used to reduce the skew in these variables. The similarity measure was then transformed into a weighting
function that was applied to the behavioural parameter sets from each donor catchment in predicting
the response of the ungauged catchment. In general, the method performed better than an estimation
of model parameters based on regression against catchment characteristics especially during recession
periods, but the full weighting method tended to underestimate the prediction uncertainty particularly for
hydrograph peaks. An ensemble of the 10 best parameter sets from the 10 most similar catchments was
better at bracketing the observed discharges for the ungauged catchments (Figure 10.1).
10.8 Direct Estimation of Hydrograph Characteristics for Constraining
Model Parameters
Another approach to assessing the uncertainty associated with the regionalisation process is provided by
Samaniego
et al.
(2010) using a new type of similarity measure based on copula distributions of discharge