Geoscience Reference
In-Depth Information
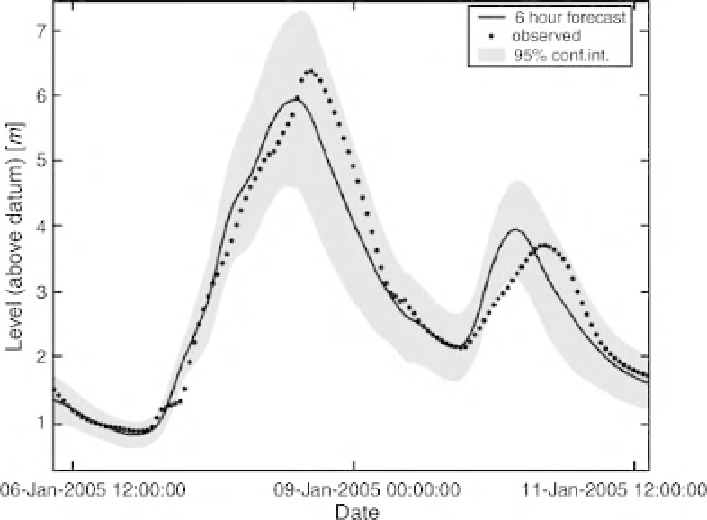
Figure 8.3
Adaptive six-hour ahead forecasts for Sheepmount gauging station, Carlisle, with 5% and 95%
uncertainty estimates for the January 2005 flood event (after Leedal et al., 2008, with kind permission of the
CRC Press/Balkema).
linear transfer functions conditional on the identified nonlinearities (see Box 4.1). The models are made
adaptive using the simple form of modified Kalman filter explained in Box 8.1.
Calibration of the model was carried out for the period March to December 2004, when the water
level at the Sheepmount gauging station in Carlisle did not exceed 4 m above base level. The model
parameters were then fixed. Figure 8.3 shows the predictions at Sheepmount for the January 2005 flood
when the water level reached 7 m above base level. Application of the model cascaded without data
assimilation underpredicts the peak (this type of forecast model is not immune to underestimation of the
inputs noted above when used without adaptation). With data assimilation both the rising limb and the
peak are predicted reasonably well (a Nash-Sutcliffe efficiency of 0.93 in the period 4th to 10th January)
and the uncertainty bounds reflect the accuracy of the prediction.
8.6 Rainfall-Runoff Modelling for Flood Frequency Estimation
Part of the problem of managing changing risk in catchments is to have an adequate estimation of
the expected frequency of extremes (either floods or droughts). Where data are available at long-term
gauging stations, it is normal to fit a statistical distribution to either the annual maximum peaks or the
peaks over a chosen threshold as a way to define the frequencies of extremes. This statistical approach
has a number of limitations. One is that we do not know what the correct distribution should be. Log
Normal, Wakeby, Generalised Extreme Value, Log Pearson Type III and a number of other distributions
have been used in the past (Cunnane, 1989; Hosking and Wallis, 1997; IH, 1999). Several different
distributions might give acceptable fits to the data available, all producing different frequency estimates
in extrapolation. Even in developed countries, such data are available at only a limited number of sites,
and for limited periods, so that the calibration may not be robust and the extrapolation to more extreme,