Geoscience Reference
In-Depth Information
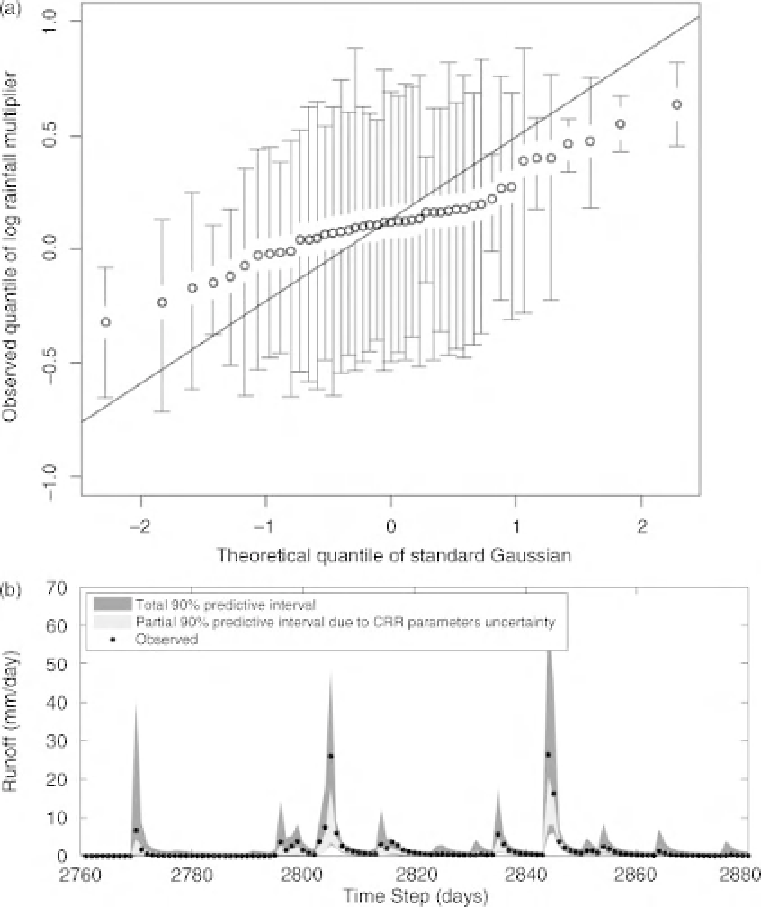
Figure 7.5
(a) Empirical distribution of rainfall multipliers determined using BATEA in an application of the
GR4 conceptual rainfall-runoff model to the Horton catchment in New South Wales, Australia; the solid
line is the theoretical distribution determined from the identification process; note the log transformation
of the multipliers: the range
1
to
1
represents values of 0.37 to 2.72 applied to individual rainstorms in
the calibration period; the difference from the theoretical distribution is attributed to a lack of sensitivity in
identifying the multipliers in the mid-range, but may also indicate that the log normal distribution might not
be a good assumption in this case; (b) validation period hydrograph showing model and total uncertainty
estimates (reproduced from Thyer
et al.
, 2009, with kind permission of the American Geophysical Union).
−
So event multipliers identified in this way are not independent of model structural errors. This gives
very much better results in calibration but gives rise to some issues in predicting the next event (and
the next and ...). Given the state of the model, and the recorded rainfall, what multiplier should be
used? This is important because the identified range of multipliers in calibration has been quite large (see
Figure 7.5). Using such a range over all events will lead to some rather wide prediction uncertainties,