Geoscience Reference
In-Depth Information
1.0
(a)
0.0
Parameter Value
1.0
(b)
Behavioural
Simulations
Nonbehavioural
Simulations
0.0
Value of Parameter 1
1.0
(c)
Behavioural
Simulations
Nonbehavioural
Simulations
0.0
Value of Parameter 2
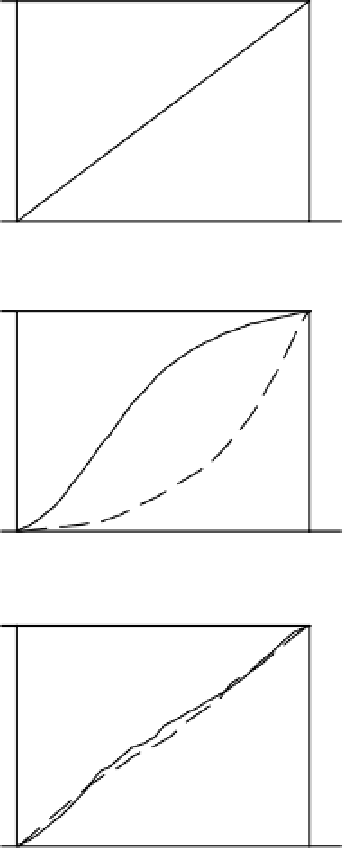
Figure 7.3
Generalised (Hornberger-Spear-Young) sensitivity analysis - cumulative distributions of parameter
values for: (a) uniform sampling of prior parameter values across a specified range; (b) behavioural and
nonbehavioural simulations for a sensitive parameter; (c) behavioural and nonbehavioural simulations for an
insensitive parameter.
Kolmagorov-Smirnov d statistic, although for large numbers of simulations this test is not robust and
will suggest that small differences are statistically significant. The d statistic can, however, be used as
an index of relative difference. This approach may be extended, given enough Monte Carlo simulation
samples, to more than two sets of parameters (the GLUE software, for example, uses 10 different classes
in assessing sensitivity). Other examples of the use of the HSY approach in rainfall-runoff modelling
include those by Hornberger
et al.
(1985), using TOPMODEL, and Harlin and Kung (1992), using the
HBV model.