Geoscience Reference
In-Depth Information
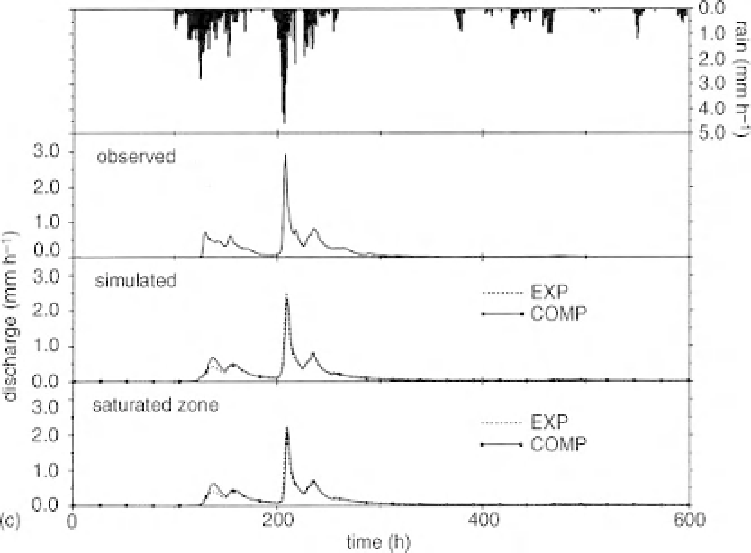
Figure 6.7
(continued)
Figure 6.7c shows the discharge predictions of two variants of TOPMODEL. In both cases, the models
were calibrated on rainfall-runoff events in 1987 and the results shown are for a separate evaluation period
in 1989.
The EXP model in Figure 6.7c is essentially the original exponential transmissivity function version
of TOPMODEL that is described in detail in Box 6.1. The COMP model uses a technique used by
Lamb
et al.
(1997, 1998b) in which a recession curve analysis is used to define an arbitrary discharge-
storage deficit relation that can replace the exponential transmissivity assumption of the original model.
In the case of the Saeternbekken MINIFELT catchment, a composite curve with exponential and linear
segments was found to be suitable. Other functions can also be used (see Box 6.1). There was little to
choose between the models in discharge prediction.
TOPMODEL, however, also allows the mapping of the predictions of storage deficit or water table
level back into the space of the catchment. While, given the approximate assumptions of the TOPMODEL
approach, the results are not expected to be accurate everywhere in the catchment, we would want to reject
the model if it was shown to give very poor predictions of such internal measurements. Results for the
recording boreholes are shown in Figure 6.8 and for the piezometer levels for five different discharges in
Figure 6.9. For these internal data, the composite model appears to give slightly better results, but clearly
both models are limited in their accuracy (notably in predicting the significant depths of ponding recorded
in some of the piezometers, since neither model has any direct representation of depression storage in
the hummocky terrain). In both cases, these predictions use the global parameter values calibrated for
the 1987 period. This effectively assumes that the transmissivity function in both models is uniform
throughout the catchment. The recording borehole data were used only in the estimation of an effective
storage coefficient, for which a catchment median calibrated value was 0.06. The piezometer data were
not used in calibration at this stage.