Geoscience Reference
In-Depth Information
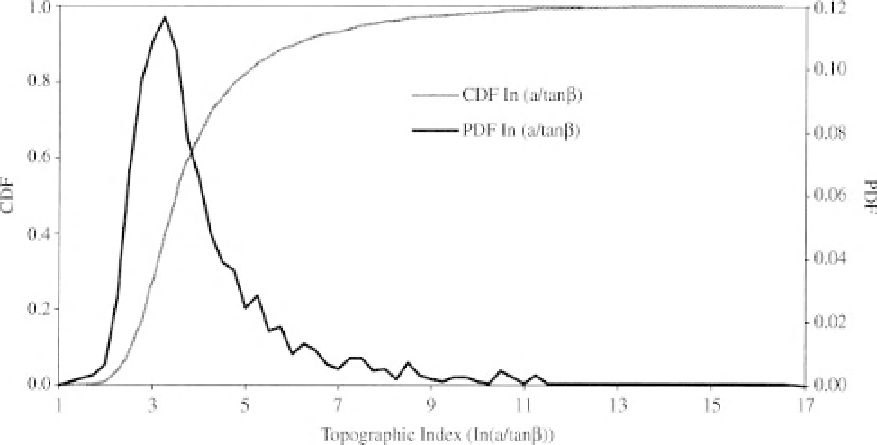
Figure 6.5
Distribution function and cumulative distribution function of topographic index values in the
Maimai M8 catchment (3.8 ha), New Zealand, as derived from the pattern of Figure 6.4.
stores to represent the unsaturated zone: one representing interception and root zone storages for which
additional deficits due to evapotranspiration are calculated; and a drainage store which controls recharge
to the saturated zone. Both introduce one additional parameter.
There is no reason why this part of the model should not be made more complex if sufficient information
is available to justify that complexity. Indeed, more complex representations of the soil and vegetation
have been linked to TOPMODEL concepts in the TOPLATS formulation of Famiglietti
et al.
(1992); by
Seuffert
et al.
(2002); in RHESSys (Band
et al.
1991, 1993; Fagre
et al.
1997; Hartman
et al.
1999); in the
MACAQUE model of Watson
et al.
(1999); and in the ISBA-TOPMODEL land surface parameterisation
(e.g. Pellenq
et al.
, 2003; Vincendon
et al.
, 2010). These can also be used as semi-distributed models
with calculations made for every pixel within a catchment (e.g. Houser
et al.
, 1998). This extension
introduces further vegetation and soil parameters. Representations of infiltration excess runoff can also
be included and, in some other applications of TOPMODEL, more explicitly physically-based approaches
to infiltration have been adopted (Beven, 1986a, 1986b, 1987; Sivapalan
et al.
, 1990; Wood
et al.
, 1990).
However, these approaches also introduce extra parameters to the model which may be difficult to
calibrate, especially for the case of spatially heterogeneous soils. Some variants on the TOPMODEL
concepts are discussed in Box 6.1.
6.3.2 Deriving the Topographic Index
An analysis of catchment topography is required in order to derive the (
a/
tan
β
) distribution function
(Figure 6.5). In order to obtain discrete values of (
a/
tan
β
) some sampling of topography is implied. Early
development of TOPMODEL relied upon the manual analysis, based on map and air photo information, of
local slope angles, upslope contributing areas and cumulative areas. Beven and Kirkby (1979) outlined a
computerised technique used to derive the topographic index distribution function (and the overland flow
delay histogram) based on the division of the catchment into sub-basin units. Each unit was then discretised
into small “local” slope elements on the basis of dominant flow paths (inferred from lines of greatest
slope in a way similar to the TAPES-C flow path analysis software of Grayson
et al.
, 1995). Calculation