Geoscience Reference
In-Depth Information
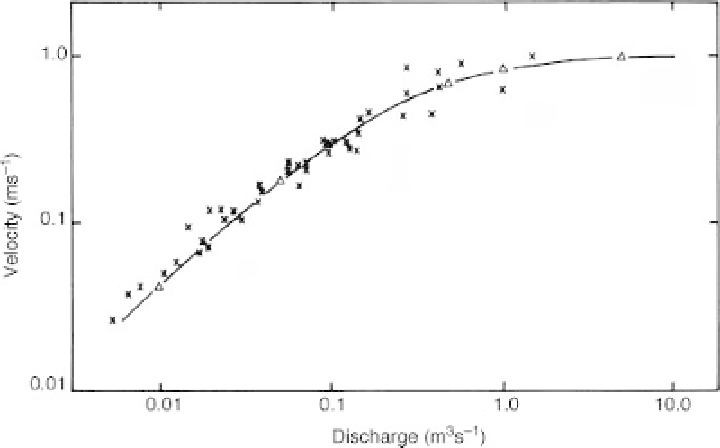
Figure 5.11
Average velocity versus discharge measurements for several reaches in the Severn catchment at
Plynlimon, Wales, together with a fitted function of the form of Equation (5.10) that suggests a constant wave
speed of 1ms
−1
(after Beven, 1979, with kind permission of the American Geophysical Union).
At a much smaller scale, Beven (1979b), for example, showed that field measurements in the channels
of a small upland catchment suggested a velocity-discharge relationship of the form
aQ
v
=
(5.10)
b
+
Q
or, assuming an irregular channel with
Q
=
vA
Q
=
a
(
A
−
b
)
(5.11)
where
b
is interpreted as the cross-sectional area at a discharge of zero (not unreasonably in a channel
with pools). This relationship gives a constant celerity of
c
=
a
for all flows, even though the flow velocity
of the water is always increasing with discharge (Figure 5.11). This then allows a further simplification
of the routing procedure to the type of constant wave velocity network width based routing discussed
in Section 4.5.1. For the particular dataset from small channels in upland Wales examined by Beven
(1979b), the value of
a
was 1 ms
−
1
.
5.5.3 Kinematic Wave Models for Subsurface Stormflow
In the application of the kinematic wave model to saturated downslope subsurface flow, a similar repre-
sentation of the catchment as one-dimensional stream tubes can be made. The important simplification
made, relative to more complex descriptions of such flows, is that the hydraulic gradient can be approx-
imated by the bed slope angle sin
β
(or, as an approximation, the surface slope). It is therefore assumed
that the water table is approximately parallel to the bed (or surface). The Darcy velocity (velocity per
unit cross-sectional area of the flow) is then given by
v
x
=
K
s
sin
β
(5.12)