Geoscience Reference
In-Depth Information
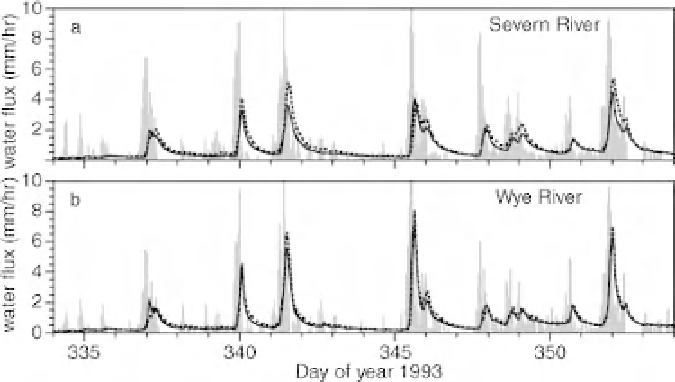
Figure 4.2
Predicted hydrographs for the Severn and Wye catchments at Plynlimon (after Kirchner, 2009,
with kind permission of the American Geophysical Union).
Once the function
g
(
Q
) has been determined, it can be used to predict discharges, given estimates of
rainfall and actual evapotranspiration and a starting value of
Q
, from:
dQ
dt
=
g
(
Q
) (
R
t
−
E
t
−
Q
t
)
(4.4)
This eliminates the need to estimate absolute values of storage (also an attraction of the ISO model in
forecasting). Some care needs to be taken over the integration of Equation(4.4) because of the nonlinearity
of
g
(
Q
). A simple first-order integration scheme will often result in instabilities in the predictions.
Kirchner suggests using a log transform, since
ln
(
g
(
Q
)) will be smoother than
g
(
Q
), but a higher order
scheme can also be easily be implemented.
It is worth noting that the function
g
(
Q
) is necessarily an approximation of the complex and dynamic
storage relationships in a catchment. It also takes no explicit account of the effects of routing delays
in the catchment, resulting from wetting the soil profile and flow in the channel network. Channel
routing velocities in these catchments are of the order of 1 ms
−
1
, giving a travel time for runoff in the
channel network of the order of 1 hour (Beven, 1979b). This will lead to some timing errors in predicted
hydrographs, although these should be small for the Plynlimon catchments (as shown in Figure 4.2).
A more interesting application of this approach is to infer effective rainfall inputs and evapotranspiration
rates from the fluctuations in discharge, what Kirchner calls “doing hydrology backwards”. Thus, inverting
Equation (4.4) we obtain:
dQ
dt
g
(
Q
)
+
R
t
−
E
t
=
Q
t
(4.5)
Thus, given the function
g
(
Q
) and a discharge time series
Q
t
, the time series of the effective input
(
R
t
−
E
t
) can be derived. When it is raining, (
R
t
−
E
t
) should be positive and
R
t
should be much greater
than
E
t
. When it is dry, (
R
t
−
E
t
) should be zero or negative and we would expect
E
t
to be greater
than
R
t
. Thus, with some approximation, rainfalls and actual evapotranspiration can be estimated as
averages over the catchment area. In some circumstances, such estimates might be more accurate than
measuring rainfalls directly, especially when there are strong patterns of rainfalls (see Newson (1980) for
an example at Plynlimon). Figure 4.3 shows a comparison of inferred and point-measured rainfalls for the
Plynlimon catchments.