Information Technology Reference
In-Depth Information
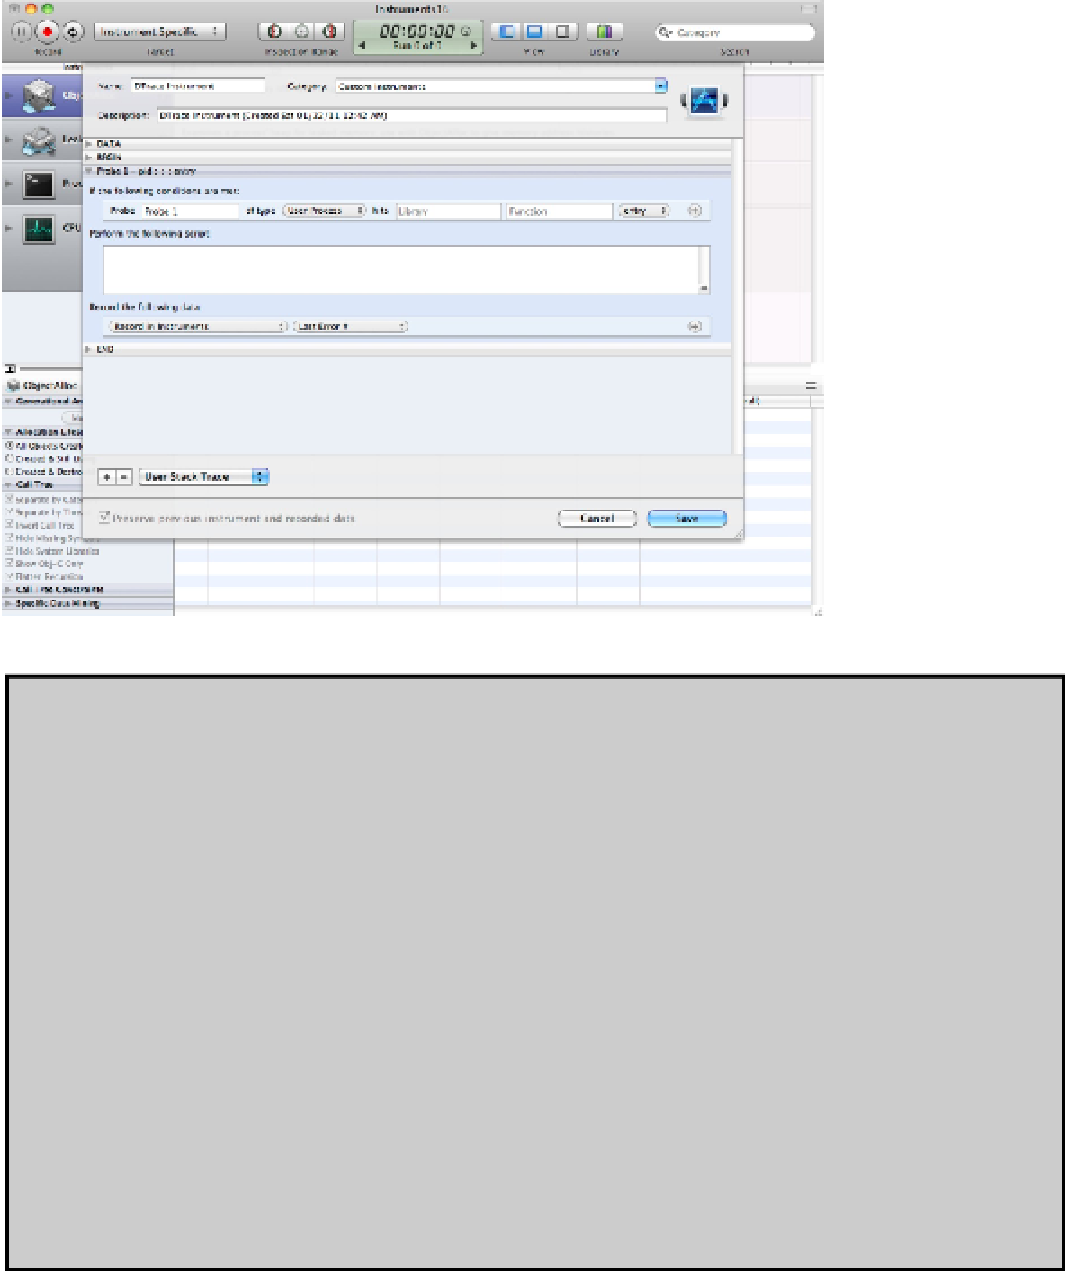
DTrace and Instruments
Internally, Instruments is based on a technology called DTrace. Originally developed by Sun Microsystems (now
Oracle) to help debug kernel and application issues in Solaris, DTrace was made available under a free Common
Development and Distribution License (CDDL) and ported to various Unix systems. Instruments, effectively, is a
GUI for DTrace, with a selection of pre-written scripts for monitoring useful performance features. Because DTrace
works at the kernel level and modifies running code, it requires kernel level privileges.
DTrace scripts are written in a custom programming language called D. The syntax of D is very similar to C, but the
program structure has more in common with the acronymically named AWK language invented by Alfred Aho,
Peter Weinberger, and Brian Kernighan.
Internally, DTrace uses a selection of providers, or access points,that are patched into key parts of the kernel. For
example, a provider called
objc
reports information about Objective-C objects in user space.
syscall
reports on
system calls in the kernel.
fbt
(function boundary tracing) reports kernel functions. Each provider can be mon-
itored by one or more probes that report on provider-level events.
You can access DTrace from the command line in Terminal with the
dtrace
command. For example, the follow-
ing dumps a list of active probes:
sudo dtrace -l