Information Technology Reference
In-Depth Information
call tree of the entire application. This gives you a very detailed view of the events in your app, but it's so
detailed that it's rarely useful.
Object List:
This is a simple linear list of objects that can be sorted by memory address, category (name,
for example), creation time, size, library, and calling context. It's identical to the object list introduced earli-
er.
Heapshots:
This creates a simple summary snapshot of heap (total memory) use. Click the Mark Heap
button at the left to measure the heap. The Heap Growth column displays the difference between the cur-
rent and previous heap sizes.
Console:
This displays a console window to monitor text output. You can select the application console
or the main system console.
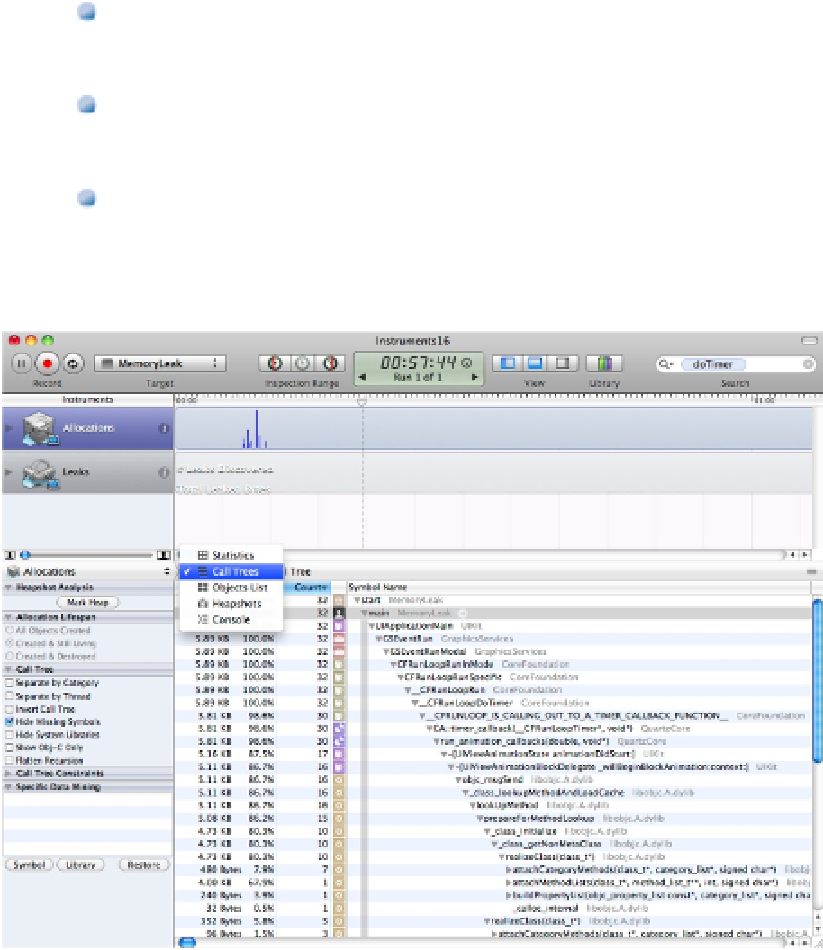
FIGURE 16.22
Selecting other types of displays in the detail pane
Modifying instrument settings
When you load a template, the instruments it contains are initialized with default settings. You can modify these
settings before or after a run by clicking the small information (i) icon at the right of the instrument to show an
Inspector dialog box, as shown in Figure 16.23. Each instrument displays a different set of options. Some op-
tions are available for many instruments.
The settings inspector is easy to overlook, but it includes powerful features. Some common settings include the
following: