Information Technology Reference
In-Depth Information
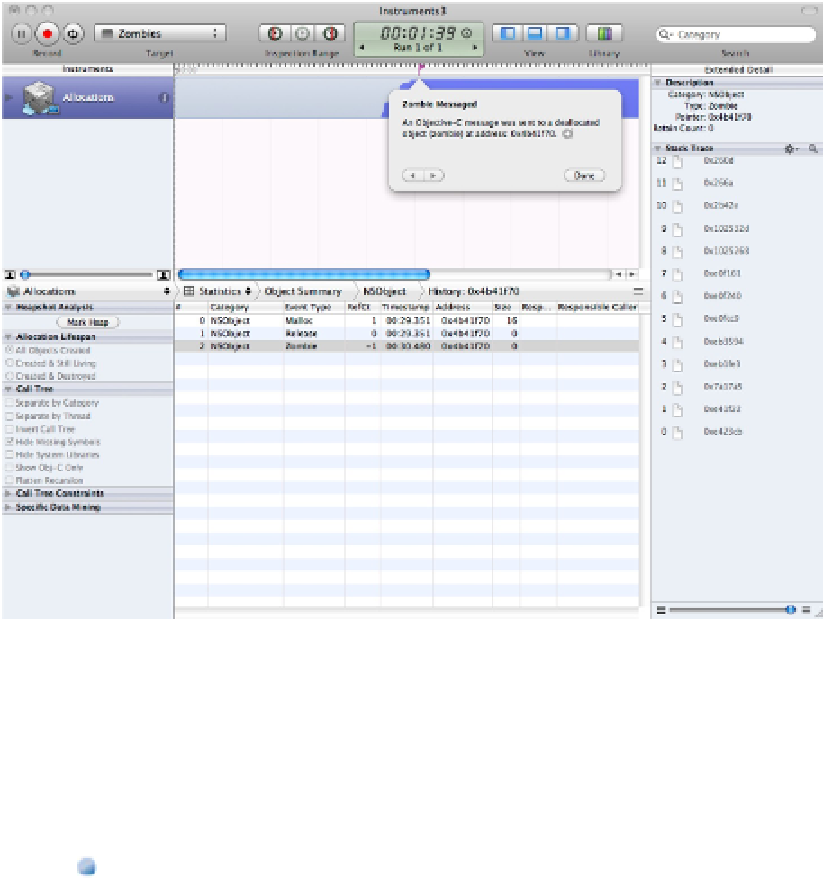
If you open the extended detail pane, you can see a stack trace for each event, as shown in the figure. Note that
the Responsible Library and Responsible Caller fields are blank in the history table and that the stack trace
doesn't include source code links. It would be useful if this information were available, but unfortunately it dis-
appears when an object is released, and the zombies display doesn't include it. Instead, you have to work back
from the hints you're given. For example, you might search the code for
NSObject
release events and monitor
each event with a breakpoint.
Usually, there's just a single zombie event, because the app crashes immediately after it encounters one. It's pos-
sible, under special circumstances, to have more than one, and the Zombies instrument displays multiple red
flags on the time line. You can view the contents of each by clicking it and using the Done button to hide the
pop-up dialog box when finished.
FIGURE 16.21
Catching a zombie
Exploring the detail pane
When you've finished exploring zombies, note that the Allocations instrument can display even more informa-
tion in the detail pane. The default view in the detail pane is called the Statistics view. But the pane can display
allocation data in other ways. You can select the other options, described later, using the menu above the detail
pane, as shown in Figure 16.22. Here's what's available:
Call Trees:
This displays a complete list of nested function and method calls. Use it with the Mark Heap
feature, described later, to display a calling context for an active method. You also can view the complete