Information Technology Reference
In-Depth Information
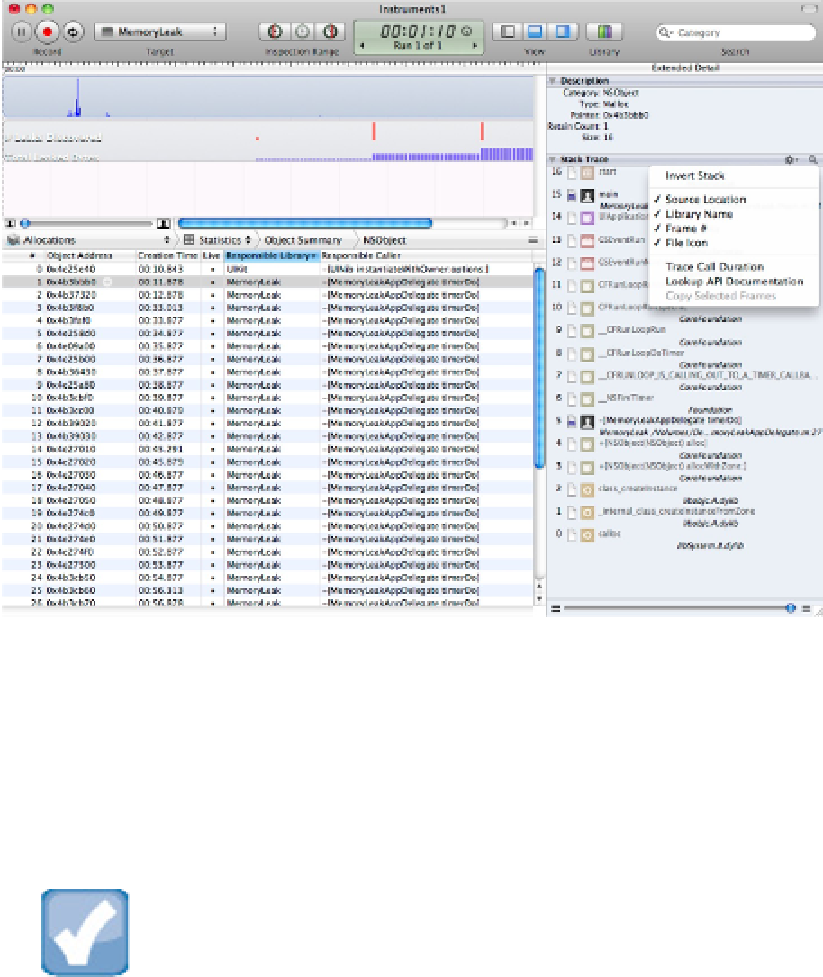
Viewing code from a stack trace
Instruments loads the source code and highlights the line associated with the event, as shown in Figure 16.17.
You can immediately see where the object was allocated.
For an object that's still active—one with a retain count greater than zero and that hasn't been released from
memory—the reference count display in Figure 16.15 shows the most recent memory management event. You
can use the source code link feature in Figure 16.17 to find the code associated with that event.
NOTE
You can use this feature to monitor system objects. But if you try to jump into the source code, you see a short as-
sembly listing, because naturally you cannot view or change the original system files.
FIGURE 16.17
Bringing it back to the source code