Information Technology Reference
In-Depth Information
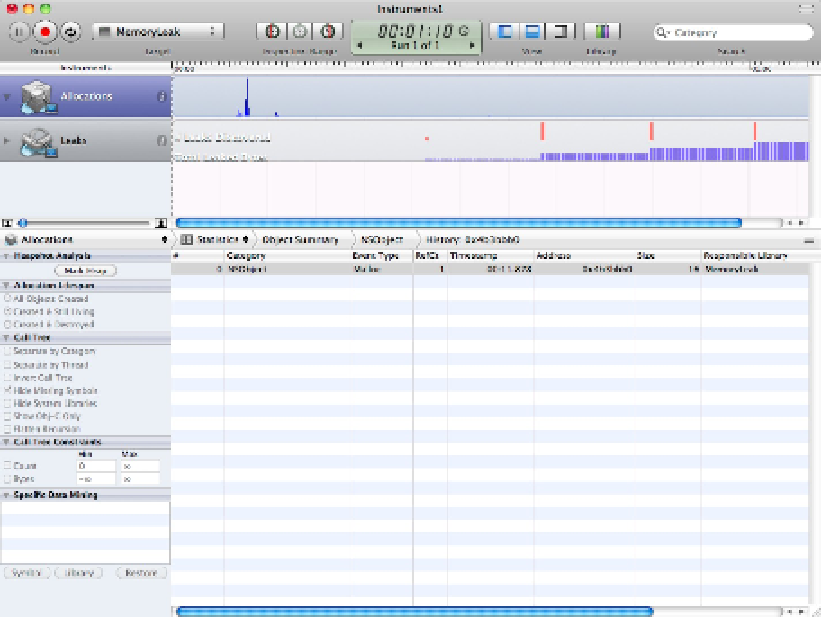
Viewing an allocation event stack trace
A related powerful option gives you precise information about the event that created an object. Select an alloca-
tion event, and click the extended detail icon in the toolbar—the one at the right of the group of three labeled
View.
You should see the display in Figure 16.16. The stack trace lists the events that preceded the allocation. You can
display further information in the trace; for example, you can list the Cocoa and OS libraries by name, highlight
user and system events with different icons, and display file links to your source code.
The latter is an extremely useful option, but because it's buried so deeply, it's easy to overlook. Use the menu
(refer to Figure 16.16) to enable every display option. Scroll down to item 5—the item that lists the allocation
event in your code, marked with the head-and-shoulders user icon. Double-click the file link to the left of the
icon.
FIGURE 16.16
Viewing an allocation stack trace