Information Technology Reference
In-Depth Information
ables data processing and display until the end of a run, minimizing the live processing overhead. Delay times can
be set in seconds, milliseconds, microseconds, or nanoseconds. (You won't often use the last option.)
CAUTION
In the first release of Xcode, Instruments sometimes fails to attach itself automatically to the iOS Simulator if you
select Product
⇒
Proile. If this happens, attach manually instead.
Note that although you can scroll along the time line graph manually, Instruments doesn't necessarily keep a re-
cord of the statistics gathered at every point. Typically, the statistics remain frozen with the values they had at
the end of the run. Although it would be useful to replay statistics manually, Instruments doesn't support this.
Selecting a trace template
To explore this process in practice, select the Project⇒Profile menu option in Xcode to create a profile build and
launch Instruments.
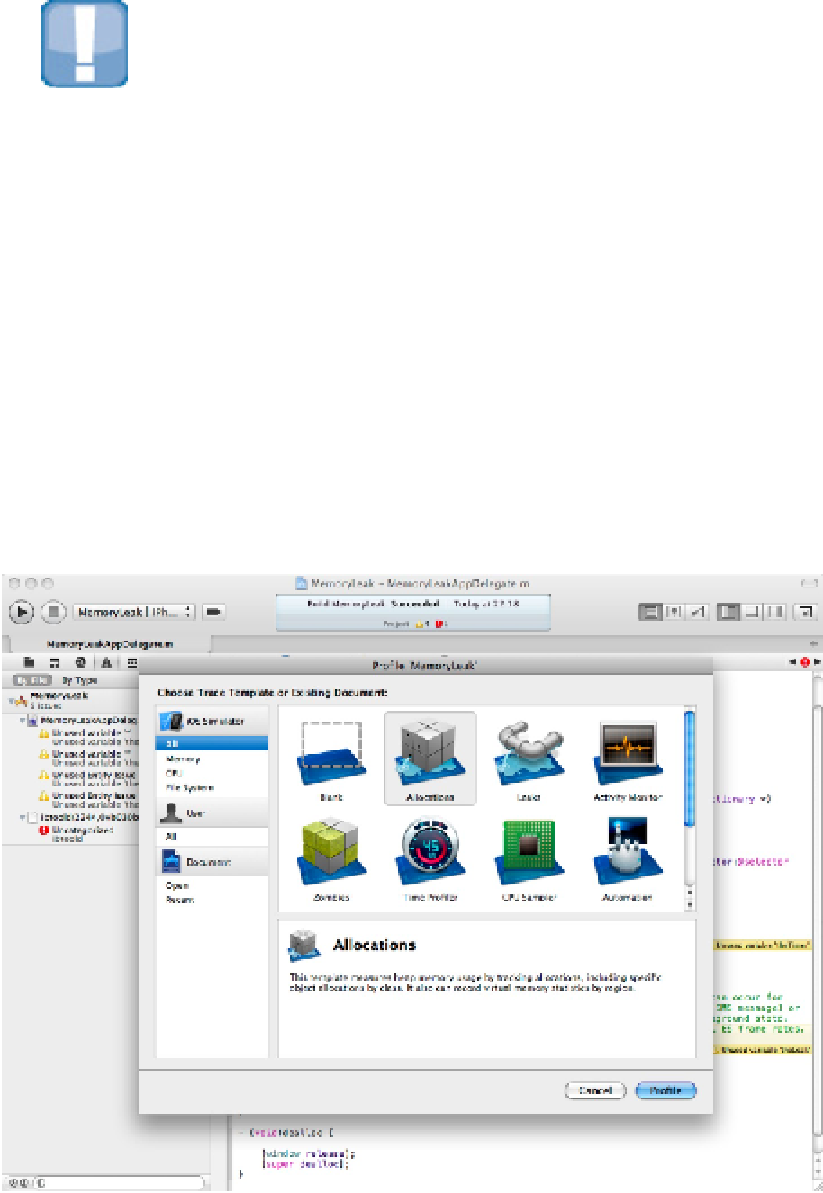
Figure 16.10 shows the Trace Template selection dialog box. Because this project is running in the iOS Simulat-
or, Instruments has pre-selected the relevant iOS Simulator Instruments. The All option at the top left displays
all available templates. You can filter them by selecting the Memory, CPU, and File System groups.
FIGURE 16.10
Selecting a template from the standard list