Information Technology Reference
In-Depth Information
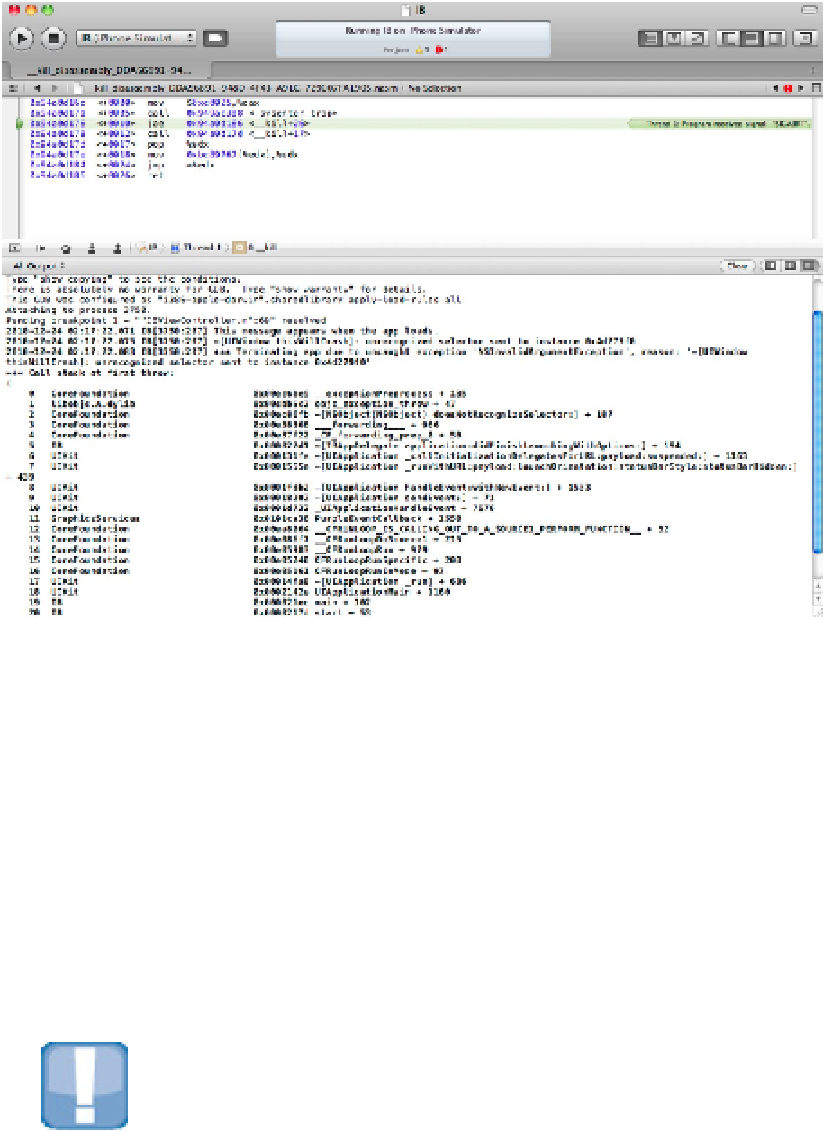
FIGURE 15.7
A clearer view of the crash event, with the Debug Navigator hidden
The next line includes supplementary information. In this example, it includes the object and the method that
caused the crash. The extra information shown here depends on the type of crash and the objects associated
with it.
The backtrace is a chronological list of messages and events that led to the crash, with the most recent events at
the top. The last few messages are usually internal to the OS. To find the event in your code that caused the
problem, look down the second column until you find the name of your app. The event to the right triggered
the crash. Previous events may have contributed to it.
The list is usually “noisy”: Lots of detail is available about internal OS objects and messages that may not be de-
scribed in the documentation. Typically, you can ignore most of the noise and concentrate on the event in your
code that created a problem. When you fix a bug in your code, you usually find that the surrounding OS fea-
tures work correctly.
CAUTION
Crash dumps aren't always as straightforward as this. If your app has serious memory errors, it may stop without
displaying any crash information at all. You can usually rely on a backtrace for useful hints. But sometimes you get
nothing at all, and the only way to find a problem is to use breakpoints.
Very
occasionally, you may get internal OS
crashes that you can't fix. This is most obvious with beta OS versions, but it does happen—extremely rarely—with