Information Technology Reference
In-Depth Information
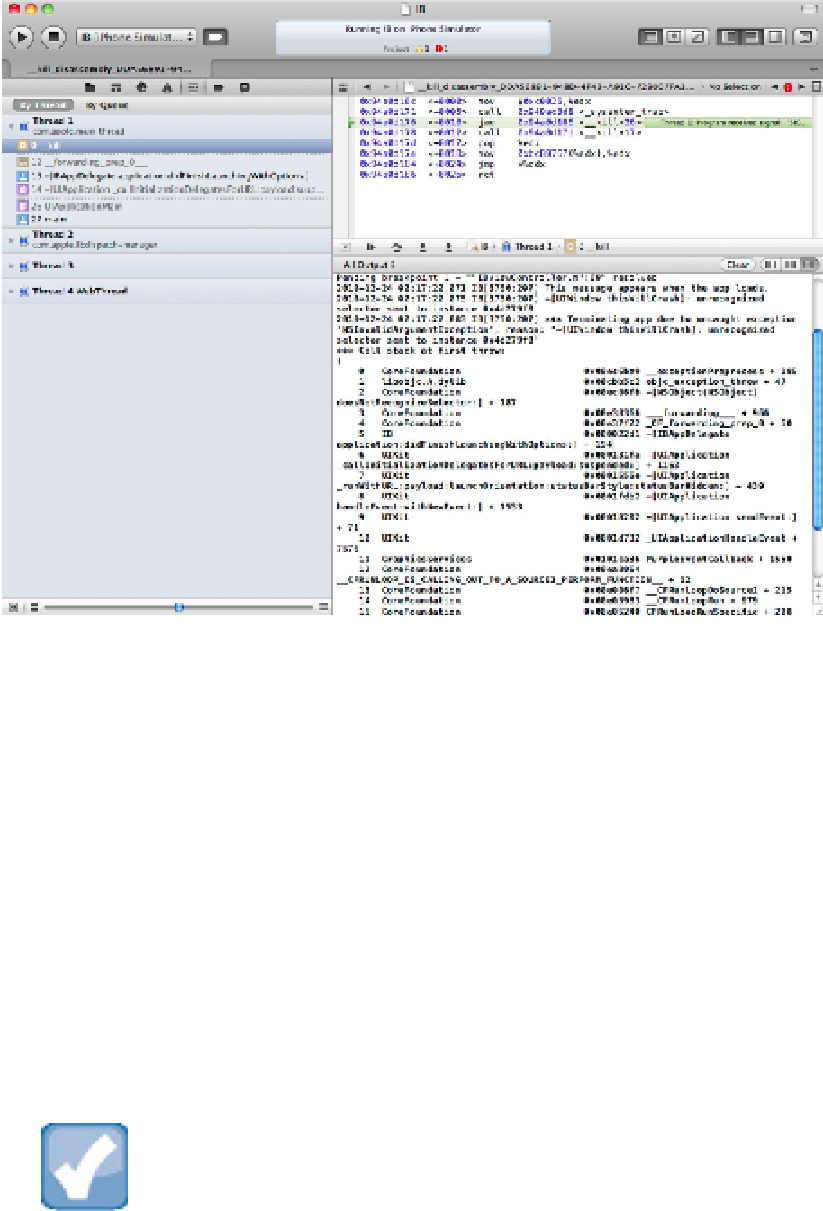
You can see immediately that the crash occurred within the
application didFinishLaunch-
ingWithOptions:
method of the
IBAppDelegate
object. In a larger project, this gives you enough in-
formation to find the file with the bug.
The top pane shows a disassembly of the code around the crash point. This is rarely useful. iOS apps trap crash
events, and this code is usually part of the iOS crash handler. Because it's in assembler and internal to iOS, you
can usually ignore it. If the crash happens in a less controlled way, and you're skilled with assembler, you may
be able to extract useful information from this listing. But it's usually easier and more productive to use Xcode's
other debugging tools.
The bottom pane shows the backtrace/stack dump. This is a more detailed version of the message list shown in
the Debug Navigator.
Figure 15.7 shows a clearer view, with the Debug Navigator hidden to expand the bottom pane and make the
backtrace easier to read. The console lists a reason for the crash:
“unrecognized selector sent to in-
stance 0x4d278f0”
. This tells you that the object at that address received a method call it couldn't execute.
NOTE
OS X applications don't always display a backtrace when they crash. Backtrace availability seems sporadic, and
depends partly on the reason for the crash and partly on the version of the OS. When no backtrace is available the
console displays a simple error description with no other information. Note also that unlike an iOS application, an
“unrecognized selector” exception
doesn't
crash a Mac app.