Information Technology Reference
In-Depth Information
At the bottom of the report is a list of Binary Images, which includes the apps and libraries running at the time.
This feature is a holdover from OS X debugging; you can use it to get information about crashes in plug-ins and
libraries. It's less relevant to iOS debugging because the item at the top of the list is usually your app.
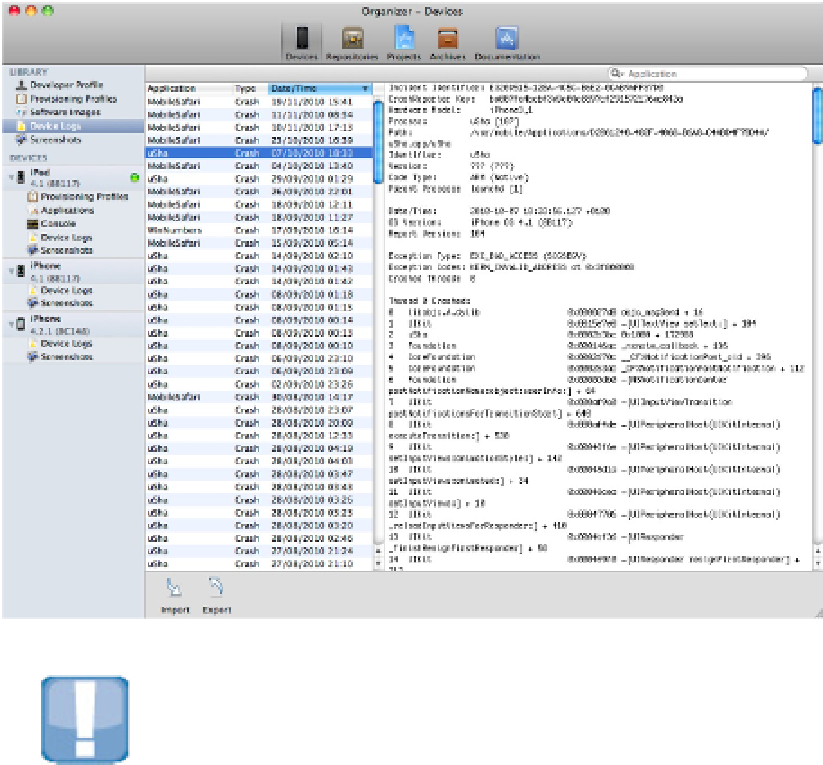
FIGURE 10.6
To make sense of a crash report stack dump, you should understand that events appear in reverse chronological
order. The most recent event caused the crash, but earlier events may have prepared it.
CAUTION
Crash dumps often list internal runtime system calls and undocumented internal Cocoa/Cocoa Touch methods.
For example, you may know that
objc_msgSend
is part of the Objective-C runtime. But the
[UIPeripher-
alHost…]
calls internal methods to UIKit, and you won't find them in the documentation. This doesn't often mat-
ter, because the backtrace usually shows in your code the method that created a problem. But occasionally with
beta code, the dump tells you that you've run into an internal bug, and you'll have to find a workaround until it's
fixed.
Understanding low memory reports
Figure 10.7 shows a low memory report. Instead of a stack dump, the panel at the right shows processes and
their memory usage. The report lists the application with the biggest memory footprint and includes a table of
all loaded processes with a page count for each. A separate status field shows which apps were running and
which were unloaded (“jettisoned”).
FIGURE 10.7