HTML and CSS Reference
In-Depth Information
Listing A-2.
Sending a WebSocket Message Using the Chrome Console
websocket.send("Hello World!");
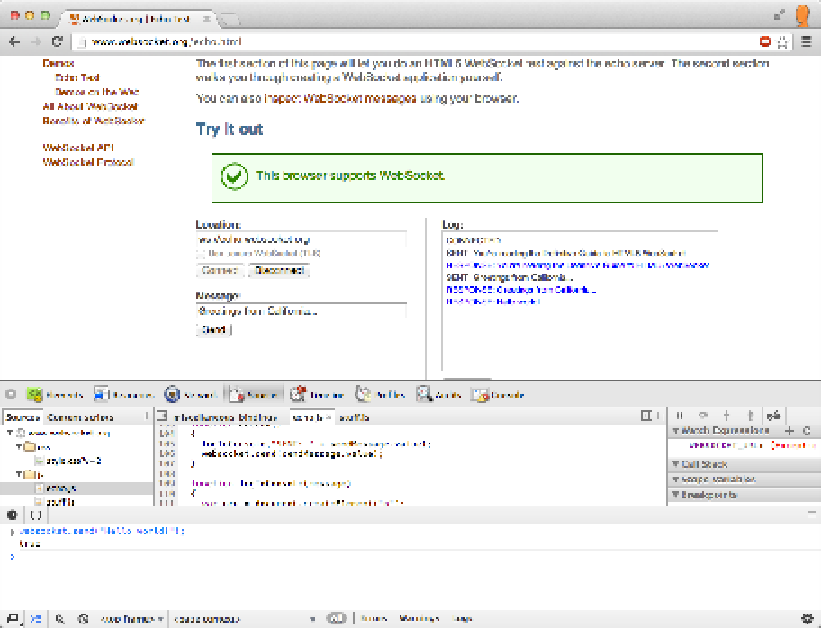
In Figure
A-5
we sent a
Hello World!
message from the console, and you can see
that in the Log window, the Echo service sent us a response. If you display your Network
tab, you can also see the corresponding WebSocket frames.
Figure A-5.
Sending WebSocket messages from the Chrome Console
As demonstrated, the Chrome Developer Tools offer web developers a simple
and effective way to “look under the hood” of their applications. Chrome's Network tab
provides unique insight not only into the WebSocket handshake but also allows you to
easily inspect the WebSocket frames.
Google Chrome Network Internals
Most of the time, Chrome Developer Tools display more than enough information to
productively develop and debug web applications. Sometimes, however, lower-level
details can help diagnose unusual connection failures or provide otherwise inaccessible
information when investigating the behavior of the browser itself. Chrome has internal
diagnostic pages that are extremely valuable in those rare situations in which you would