Database Reference
In-Depth Information
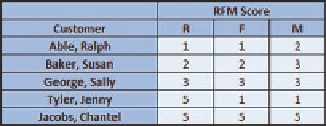
Figure 12-20
The RFM Score Report
Each customer is
ranked for
R
(recent),
F
(frequent), and
M
(money)
characteristics—1 is
highest (best) and 5 is
lowest (worst) score
Susan Baker (RFM score of {2 2 3}) is above average in terms of how frequently she shops
and how recently she has shopped, but her purchases are average in value. Sally George (RFM
score of {3 3 3}) is truly in the middle. Jenny Tyler (RFM score of {5 1 1}) is a problem. Jenny has
not ordered in some time, but, in the past, when she did order, she ordered frequently and her
orders were of the highest monetary value. These data suggest that Jenny might be going to
another vendor. Someone from the sales team should contact her immediately. However, no
one on the sales team should be talking to Chantel Jacobs (RFM score of {5 5 5}). She has not
ordered for some time, she doesn't order frequently, and when she does order, she only buys
inexpensive items and not many of them.
OLAP
OLAP provides the ability to sum, count, average, and perform other simple arithmetic opera-
tions on groups of data. OLAP systems produce
OLAP reports
. An OLAP report is also called
an
OLAP cube
. This is a reference to the dimensional data model, and some OLAP products
show OLAP displays using three axes, like a geometric cube. The remarkable characteristic
of an OLAP report is that it is dynamic: The format of an OLAP report can be changed by the
viewer, hence the term
online
in the name OnLine Analytical Processing.
OLAP uses the dimensional database model discussed earlier in this chapter, so it is not
surprising to learn that an OLAP report has measures and dimensions. A measure is a dimen-
sional model
fact
—the data item of interest that is to be summed or averaged or otherwise
processed in the OLAP report. For example, sales data may be summed to produce Total
Sales or averaged to produce Average Sales. The term
measure
is used because you are dealing
with quantities that have been or can be measured and recorded. A dimension, as you have
already learned, is an attribute or a characteristic of a measure. Purchase date (TimeID), cus-
tomer location (City), and sales region (ZIP or State) are all examples of dimensions, and in the
HSD-DW database, you saw how the time dimension is important.
In this section, we will generate an OLAP report by using an SQL query from the HSD-DW
database and a Microsoft Excel
PivotTable
.
By The WAy
We use Microsoft SQL Server 2012 and Microsoft Excel 2013 to illus-
trate this discussion of OLAP reports and PivotTables. For other DBMS
products, such as MySQL, you can use the DataPilot feature of the Calc spreadsheet
application in the OpenOffice.org product suite (see
www.openoffice.org)
.
Now we can:
●
Manually copy and format an SQL query as a formatted table in a Microsoft Excel
worksheet:
●
Copy the SQL query results into an Excel worksheet.
●
Add column names to the results.
●
Format the query results as an Excel table (optional).
●
Select the Excel range containing the results with column names.
●
Create the PivotTable.


Search WWH ::

Custom Search