Database Reference
In-Depth Information
ENGINE
ENGINE
EngineNumber
EngineNumber
Type
HorsePower
Type
HorsePower
First Boxcar
First Boxcar
BOXCAR
BOXCAR
BoxCarNumber
BoxCarNumber
Capacity
Type
BoxCarNumberAhead (FK) (AK1.1)
Capacity
Type
Boxcar Ahead
Boxcar Ahead
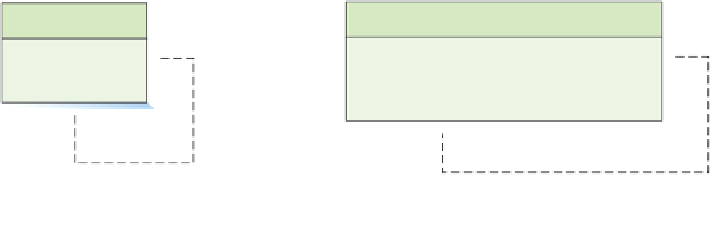
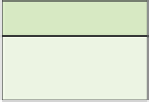
Figure 6-20
Transformation of 1:1
Recursive Relationships
(b)
Database Design for a 1:1
Recursive Relationship
(a)
Data Model for a 1:1 Recursive
Relationship in Figure 5-38
By The Way
If you find the concept of recursive relationships confusing, try this trick.
Assume that you have two entities, BOXCAR_AHEAD and BOXCAR_
BEHIND, each having the same attributes. Notice that there is a 1:1 relationship between
these two entities. Replace each entity with its table. Like all 1:1 strong entity relation-
ships, you can place the key of either table as a foreign key in the other table. For now,
place the key of BOXCAR_AHEAD into BOXCAR_BEHIND.
Now realize that BOXCAR_AHEAD only duplicates data that reside in BOXCAR_
BEHIND. The data are unnecessary. So, discard BOXCAR_AHEAD and you will have
the same design as shown in Figure 6-20(b).
1:N Recursive Relationships
As with all 1:N relationships, 1:N recursive relationships are represented by placing the pri-
mary key of the parent in the child as a foreign key. Consider the Manages relationship in
Figure 6-21(a), which is the data model we developed in Figure 5-41. In this case, we place the
name of the manager in each employee's row. Thus, in Figure 6-21(b), the EmployeeNameMgr
has been added to the EMPLOYEE table.
Notice that both the parent and the child are optional. This is true because the lowest-
level employees manage no one and because the highest-level person, the CEO or other
most senior person, has no manager. If the data structure were circular, this would not be
the case.
N:M Recursive Relationships
The trick for representing N:M recursive relationships is to decompose the N:M relationship
into two 1:N relationships. We do this by creating an intersection table, just as we did for N:M
relationships between strong entities.
Figure 6-22(a) is the data model we developed in Figure 5-43. It shows the solution to an
example for a bill-of-materials problem. Each part has potentially many subordinate parts, and
each part can be used as a component in potentially many other parts. To represent this rela-
tionship, create an intersection table that shows the correspondence of a part/part use. You
can model upward or downward. If the former, the intersection table will carry the correspon-
dence of a part and where that part is used. If the latter, the intersection table will carry the
correspondence of a part and the parts that it contains. Figure 6-22(b) shows the intersection
table for modeling downwards in the bill of materials.


Search WWH ::

Custom Search