Environmental Engineering Reference
In-Depth Information
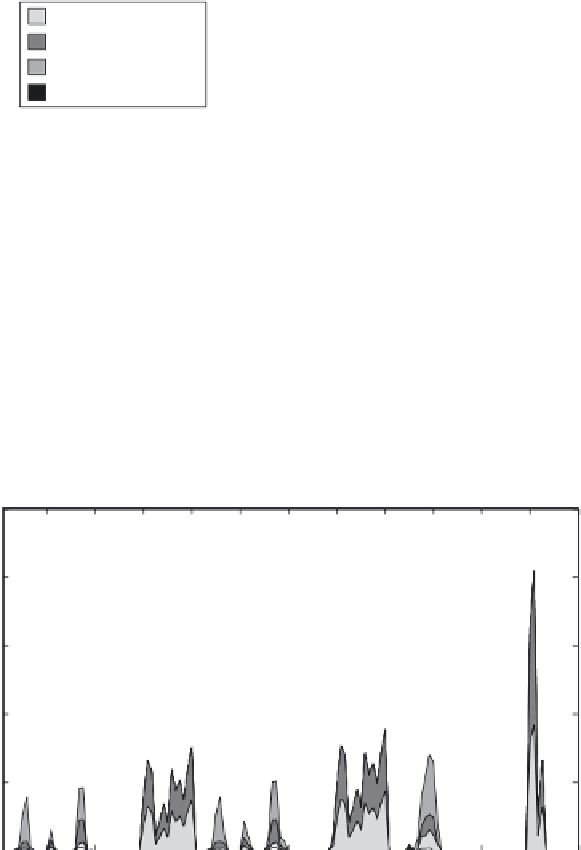
PHEV charging profile − present UK power market scenario
1
Mobile load node 1
Mobile load node 2
Mobile load node 3
Mobile load node 4
0.8
0.6
0.4
0.2
0
6
12
18
24
6
12
18
24
6
12
18
24
Time (h)
Figure 7.11
Illustrates optimal PHEV charging for scenario 2
PHEV charging profile − future UK power market scenario
1
Mobile load node 1
Mobile load node 2
Mobile load node 3
Mobile load node 4
0.8
0.6
0.4
0.2
0
6
12
18
24
6
12
18
24
6
12
18
24
Time (h)
Figure 7.12
Illustrates optimal PHEV charging for scenario 3
there is more charging taking place in node 1 (commercial area) in the middle of day
and furthermore capacities being drawn from residential nodes are slightly lower. It
is worth mentioning that almost no charging takes place in node 4 due to the fact that
while PHEVs are plugged-in in this part of the network it is not that attractive to do


Search WWH ::

Custom Search