Environmental Engineering Reference
In-Depth Information
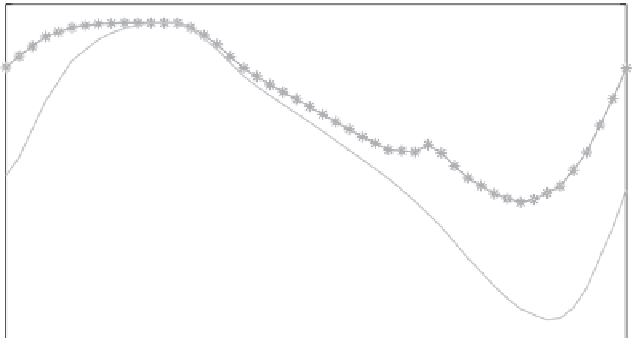
Aggregated battery state of charge
20
18
16
2
3
4
5
6
7
14
12
10
2
4
6
8
10
12
14
16
18
20
22
24
Time (h)
Figure 6.27
Aggregated battery storage SOC profiles from the TCOPF operating
strategies
The PHEV penetration modelled for these case scenarios allow us to visualise
the great amount of back-up capacity the battery stores can potentially offer for
demand response programs and other ancillary services;
●
Since cases 2-4 do not reach the minimum state of charge (e.g. 10 MWh
el
)
twice as in cases 5-7, batteries are underutilised and the optimal management is
achieved by applying strategies similar to cases 5-7.
●
Figures 6.28-6.33 show the manner in which electro-chemical stores are dis-
patched for the simulations conducted; the values provided are the
net injections
occurring at
each node
for the time intervals being analysed. Positive values indi-
cate aggregated PHEV units in the node are charging (G2V), while negative values
correspond to moments when nodes provide back-up capacity to the grid (V2G).
The net nodal battery storage dispatch establishes the following patterns:
Since in case 2 there is a continuous charge of PHEVs, the V2G injections
go unnoticed while there are three pronounced peaks throughout the day; on the
other hand for case 3, although subtle, the delayed charging allows us to visualise
the V2G injections;
●
Cases 4 and 5 have similar dispatch patterns because the charging of vehicles
mainly occurs late at night and during the early morning, although in case 4 it
extends to midday (
i.e.
reducing fuel costs) while in case 5 they concentrate
before 7 a.m. (
i.e.
reducing network losses); likewise, although at different
intensities, the V2G injections of batteries happen during moments of peak
demand;
●


Search WWH ::

Custom Search