Environmental Engineering Reference
In-Depth Information
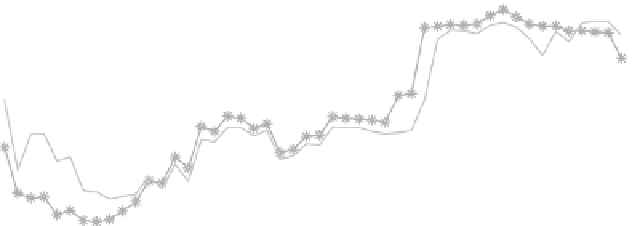
Electric load profile at supply point
6
1
2
3
4
5
4
3
2
1
0
2
4
6
8
10
12
14
16
18
20
22
24
Time (h)
Figure 6.23
Electric load profile results from TCOPF operating strategies cases 2,
3 and 4 compared to case 1
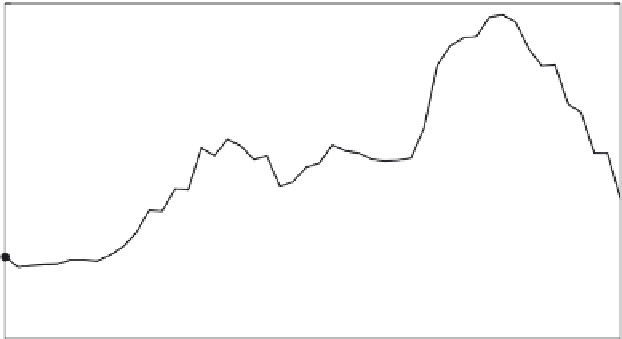
Electric load profile at supply point
6
1
5
6
7
5
4
3
2
1
0
2
4
6
8
10
12
14
16
18
20
22
24
Time (h)
Figure 6.24
Electric load profile results from TCOPF operating strategies cases 5,
6 and 7 compared to case 1
prolonged high-demand periods after the evening has passed since PHEVs begin
charging at 10 p.m.;
Case 4 has a similar profile to cases 2 and 3, but it takes a wiser approach in the
use of micro-CHP and V2G injections; consequently, the midday valley and peak
demand are less prominent;
●


Search WWH ::

Custom Search