Environmental Engineering Reference
In-Depth Information
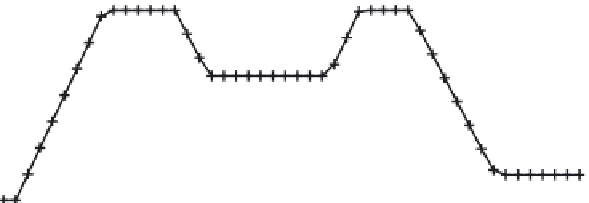
Aggregated thermal storage state of charge
7
6
5
4
2
3
4
5
6
7
3
2
1
0
2
4
6
8
10
12
14
16
18
20
22
24
Time (h)
Figure 6.16
Aggregated thermal storage SOC profiles from the TCOPF operating
strategies
this explains why at midnight the SOC value is so high and why there is almost
null discharge during moments of peak demand;
Cases 4, 5, 6 and 7 have a smoother operation by injecting thermal power into
the stores during the early hours of the morning and during early afternoon; this
fact enables a better management of the storage systems by having two peaks
(
i.e.
7 a.m. and 4 p.m.), which subsequently are discharged;
●
Figures 6.17-6.22 show the manner in which the thermal stores are dispatched
per node; the values provided are the
net injections
occurring at
each node
for the
day being analysed. Positive values indicate when the thermal stores are charging,
while negative values correspond to discharge injections.
The net nodal thermal storage dispatch establishes the following patterns:
Only in cases 2 and 3, even though in small amounts, do the thermal storage
units discharge during early morning. Meanwhile, charging occurs during early
afternoon and late at night while discharge mainly occurs early in the evening.
It is worth mentioning the energy magnitudes for these cases are much lower than
others, a perfect example of mismanagement of resources;
●
Cases 4 and 5 have broadly similar dispatch patterns because the charging of
facilities occur in early morning and early afternoon, meanwhile the discharge
of thermal power happens during moments of peak demand; nevertheless, all of
these injections occur at different magnitudes for each case;
●
Although in case 5 thermal stores are free to operate whenever necessary, the
systems only work for specific time intervals, illustrating that in order to reduce
losses the storage resources should be used sporadically and this leads to a
●


Search WWH ::

Custom Search