Graphics Reference
In-Depth Information
1
A
1
2
B
5
4
6
1
3
9
2
8
10
7
C
12
D
50
13
15
32
1
47
40
39
49
22
11
19
44
18
4
2
26
33
9
30
21
29
6
42
7
36
3
25
31
27
28
48
34
5
8 0 541
17
20
24
37
46
16
38
35
43
14
23
23 4 5 6 7 89
1
E
10
11
12
13
14
15
16
17
16
19
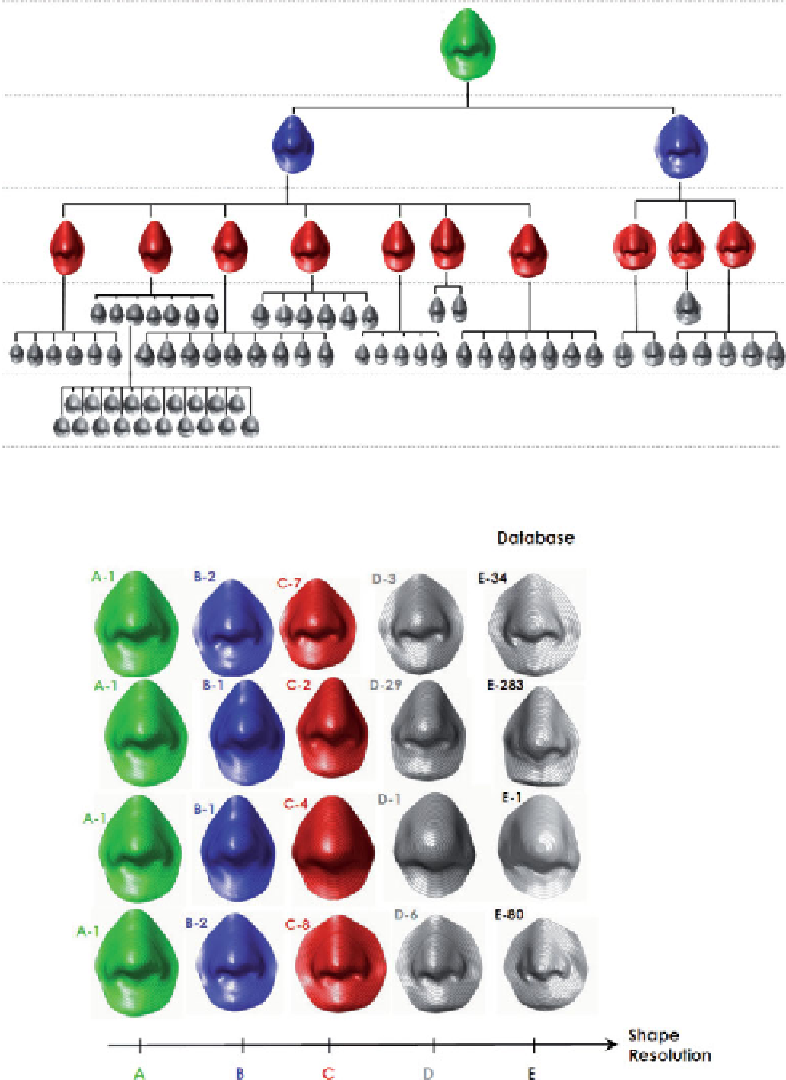
Figure 3.25
The tree resulting on hierarchical clustering. Copyright
C
2009, IEEE
Figure 3.26
Paths from top to buttom in the tree show increasing shape resolutions. Copyright
C
2009, IEEE