Graphics Reference
In-Depth Information
50
0
20
(c)
(a)
(b)
Figure 3.20
Restoration of curves of different index
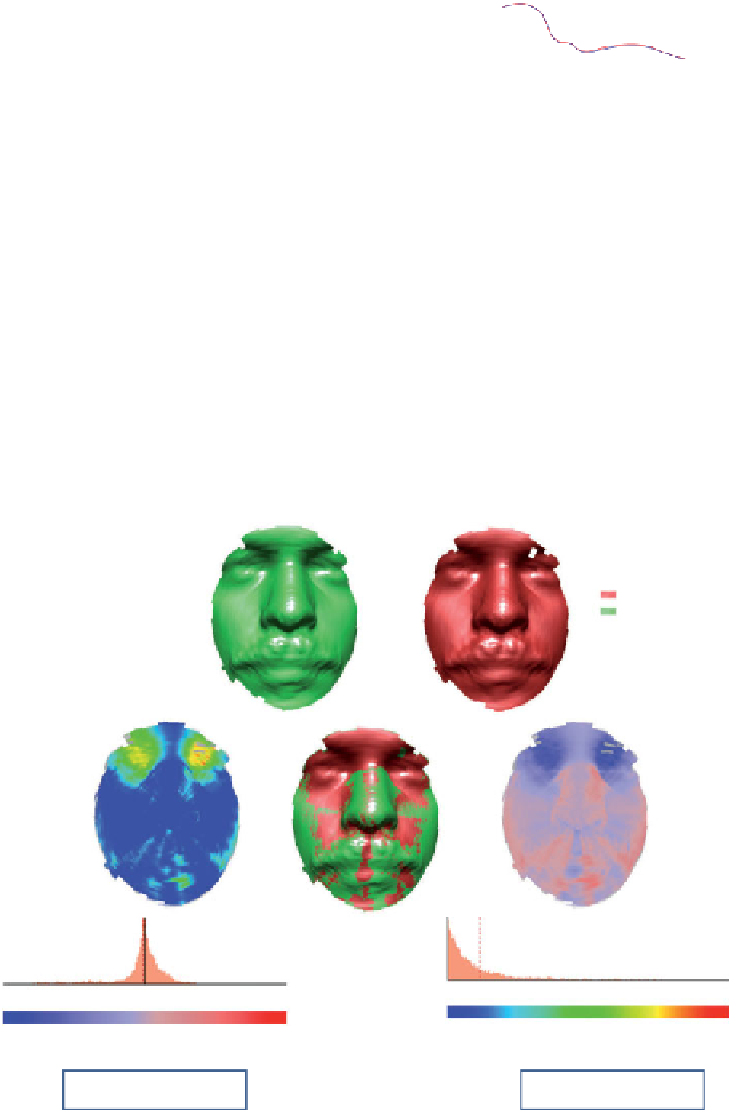
the original and restored face together. The left and right images illustrate, respectively, the
signed and absolute deviation between the original and the restored face. The average absolute
deviation is 0.21 mm with 0.28 mm as standard deviation. These observations demonstrate on
the closeness of the restored face to the original one. Therefore, we propose next to restore
curves with missing data and keep complete ones.
In order to evaluate the face recovery procedure, we compare the restored facial surface
(shown in the top row of Figure 3.22) with the complete neutral face of that class, as shown in
Figure 3.22. Small values of both absolute deviation and signed deviation between the restored
face and the corresponding face in the gallery demonstrate the success of the restoration
process.
Retord face
Original face
average
average
Total distribution:
100.00000%
Total distribution:
100.00000%
0.00000
0.40000
0.80000
1.20000
1.60000
2.00000
-2.00000
-1.20000
0.00000
0.80000
2.00000
(b) absolute deviation
(a) signed deviation
Average distance = 0.02 mm
Standard deviation = 0.35 mm
Average distance = 0.21 mm
Standard deviation = 0.28 mm
Figure 3.21
Restoration of full face: the absolute and signed deviations