Biology Reference
In-Depth Information
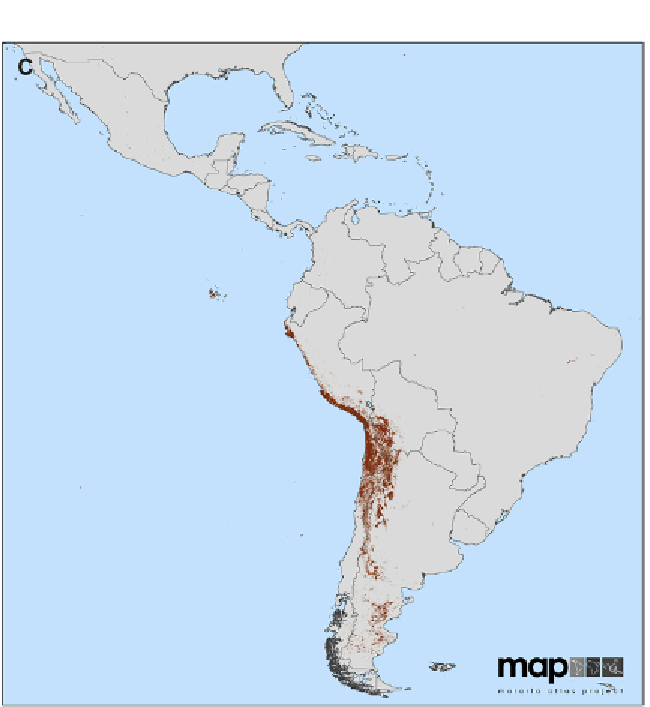
Figure 1.6, cont'd
consultation with vector experts (
Hay et al., 2010c
;
Sinka et al., 2010a
,
2010b
,
2011
). The resulting maps illustrate the predicted distribution of the
DVS using a probability of occurrence metric. While the ecological covari-
ates of the model are based on annualised means of temperature and precip-
itation, the maps cannot represent the season fluctuations that may occur in
the distribution of the DVS, which may be significant in those that extend
into temperate climes. Expert opinion was also used to classify the most
important species /combinations of species per region (i.e. those with the
highest impact) and their individual distributions were overlaid, with the
most competent vectors species uppermost, to generate the maps shown.
The combined vector map aims to aid vector control planning by showing
which species need to be controlled in each area.