Biology Reference
In-Depth Information
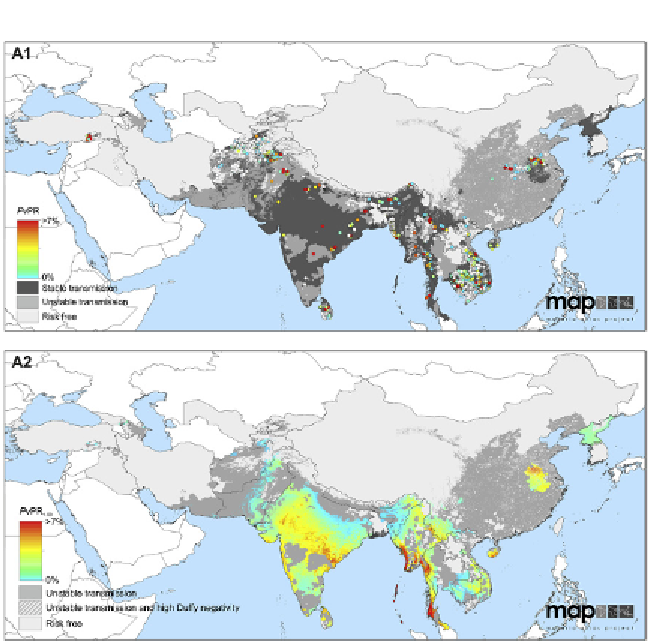
Figure 1.3
The spatial distribution of
Plasmodium vivax
malaria endemicity in 2010
in Asia, Asia-Pacific, the Americas and Africa+.
The spatial distribution of
P. vivax
malaria endemicity is shown at the regional levels: Asia (A), Asia-Pacific (B), the Ameri-
cas (C) and Africa+ (D). Panel 1 in A-D shows the 2010 spatial limits of
P. vivax
malaria
risk defined by
Plasmodium vivax
annual parasite incidence (
Pv
API) with further medi-
cal intelligence, temperature and aridity masks. Areas were defined as stable (dark grey
areas, where
Pv
API
≥
0.1 per 1000 per annum), unstable (medium grey areas, where
Pv
API < 0.1 per 1000 p.a.) or no risk (light grey, where
Pv
API = 0 per 1000 p.a.). Only the
P. vivax
malaria endemic countries (
Pv
MECs) in each region are shaded in. The commu-
nity surveys of
P. vivax
prevalence conducted between January 1985 and June 2010 are
plotted. The survey data are presented as a continuum of light blue to red (see map leg-
end), with zero-valued surveys shown in white. Panel 2 in each region shows the model-
based geostatistics (MBG) point estimates of the annual mean
Pv
PR
1-99
for 2010 within
the spatial limits of stable
P. vivax
malaria transmission, displayed on the same colour
scale. Areas within the stable limits (Panel 1) that were predicted with high certainty
(>0.9) to have a
Pv
PR
1-99
less than 1% were classed as unstable. Areas in which Duffy
negativity gene frequency is predicted to exceed 90% (
Howes et al., 2011
) are shown
in hatching for additional context. For interpretation of the references to colour in this
igure legend, the reader is referred to the online version of this topic.