Geoscience Reference
In-Depth Information
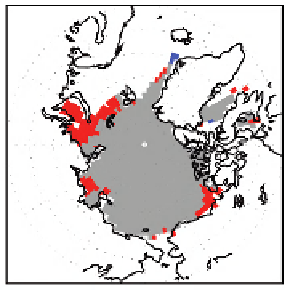
Plate 1.
Evolution of sea ice extent during the boreal summer months of June-August of 1995. Blue (red) squares indi-
cate enhanced (reduced) ice when compared to the monthly mean ice extent (represented by gray plus red areas).
Plate 2.
(a) Net surface heat flux anomalies (sensible plus latent plus longwave) felt by the atmosphere and (b) surface air
temperature (SAT) anomalies in August of Sum95e. Dark (light) red or blue indicates statistical significance at the 99%
(95%) or greater level based on a pooled variance
t
test. Confidence interval (CI) is 5 W m
-2
and 0.5 K for heat flux and
SAT, respectively. This is a polar stereographic view from 40° to 90°N.


Search WWH ::

Custom Search