Geoscience Reference
In-Depth Information
where a
i
is the albedo averaged over all ice thickness catego-
ries, a
o
is the albedo of open water, and
A
i
is the fraction of
the grid cell covered by sea ice. In the fixed-albedo runs, the
grid cell average albedo is fixed to
thickness, such that thicker ice is far more variable (see
Figure 2). Therefore the control runs are at least 150 years
long, and all averages were taken for the last 100 years. The
perturbed runs, which are thinner, were run for at least 80
years, and averages were taken for the last 50 years (thinner
ice also equilibrates faster [see
Bitz and Roe
, 2004]).
The procedure for fixing the albedo succeeded to the ex-
tent that the fixed-albedo control reproduces the total surface
albedo (sum of all four components) of the normal control
when averaged June-August with an average random error
of 0.0095 (the standard deviation across grid cells with sea
ice) and a systematic error of 0.006 (the average difference
across grid cells with sea ice). The average total surface
albedo over the same area and months is 0.5. Hence com-
pared to the total, the random error is less than 2%, and the
systematic error is about 1.2%. When comparing the total
surface albedo in the fixed-albedo perturbed run to the fixed-
albedo control, the errors are even lower, with a random er-
ror of 0.2% and a systematic error of 0.7%.
The sea ice thickness in the fixed-albedo control has nearly
the same pattern of thickness in the normal control, but it
tends to be 10-30 cm thicker in the Arctic Ocean (see Figure
2, with an across-grid cell average random error of 33 cm
and systematic error of 19 cm in 100-year averages from
each control. This thickness difference is almost 10% of the
model's mean ice thickness in the Arctic Ocean. Because
the percentage of systematic error in the surface albedo is so
much smaller, it would appear that variations in the surface
albedo have a nonlinear influence on sea ice thickness.
The goal of this study is to investigate the influence of
the mean thickness on the 21st century sea ice retreat. The
difference in the mean state of the fixed-albedo control and
the normal control is therefore an issue that must be consid-
ered. In the next section, changes from doubling CO
2
are
computed with respect to the control that corresponds to the
experiment: Normal perturbed is compared to normal con-
trol and fixed-albedo perturbed is compared to fixed-albedo
control.
D
fix
> D
i
@>
A
i
@ >D
o
@1 >
A
i
@,
(2)
where the brackets denote the climatological monthly mean
annual cycle that is taken from the normal control run.
Even though the grid cell average albedo is held fixed, the
ice fraction may depart from the climatological mean accord-
ing to the evolution of the climate in the model (particularly
when CO
2
is raised to 710 ppm). When this occurs,
-
i
or a
o
is adjusted to maintain a = a
ix
, as illustrated in Figure 1.
The sea ice thickness in the model exhibits considerable
low-frequency variability. As previously discussed by
Bitz
et al.
[1996], the variability is a strong function of the mean
3.3. Ice-Albedo Feedback Quantified
The annual mean ice thickness and March and September
extents from the normal control are shown in Plate 2a. As
in many climate models [see, e.g.,
Holland and Bitz
2003],
the thickness pattern is biased. The thickest ice appears in
the Chukchi Sea and in the center of the Arctic Ocean rather
than next to the Canadian Archipelago. These biases result
primarily from errors in the surface circulation in the model
[
Bitz et al.
, 2001]. The thickness biases in CCSM3 are sig-
nificantly reduced in integrations at T85 [
DeWeaver and
Bitz
, 2006]. Thus the ice thickness patterns in CCSM3 runs
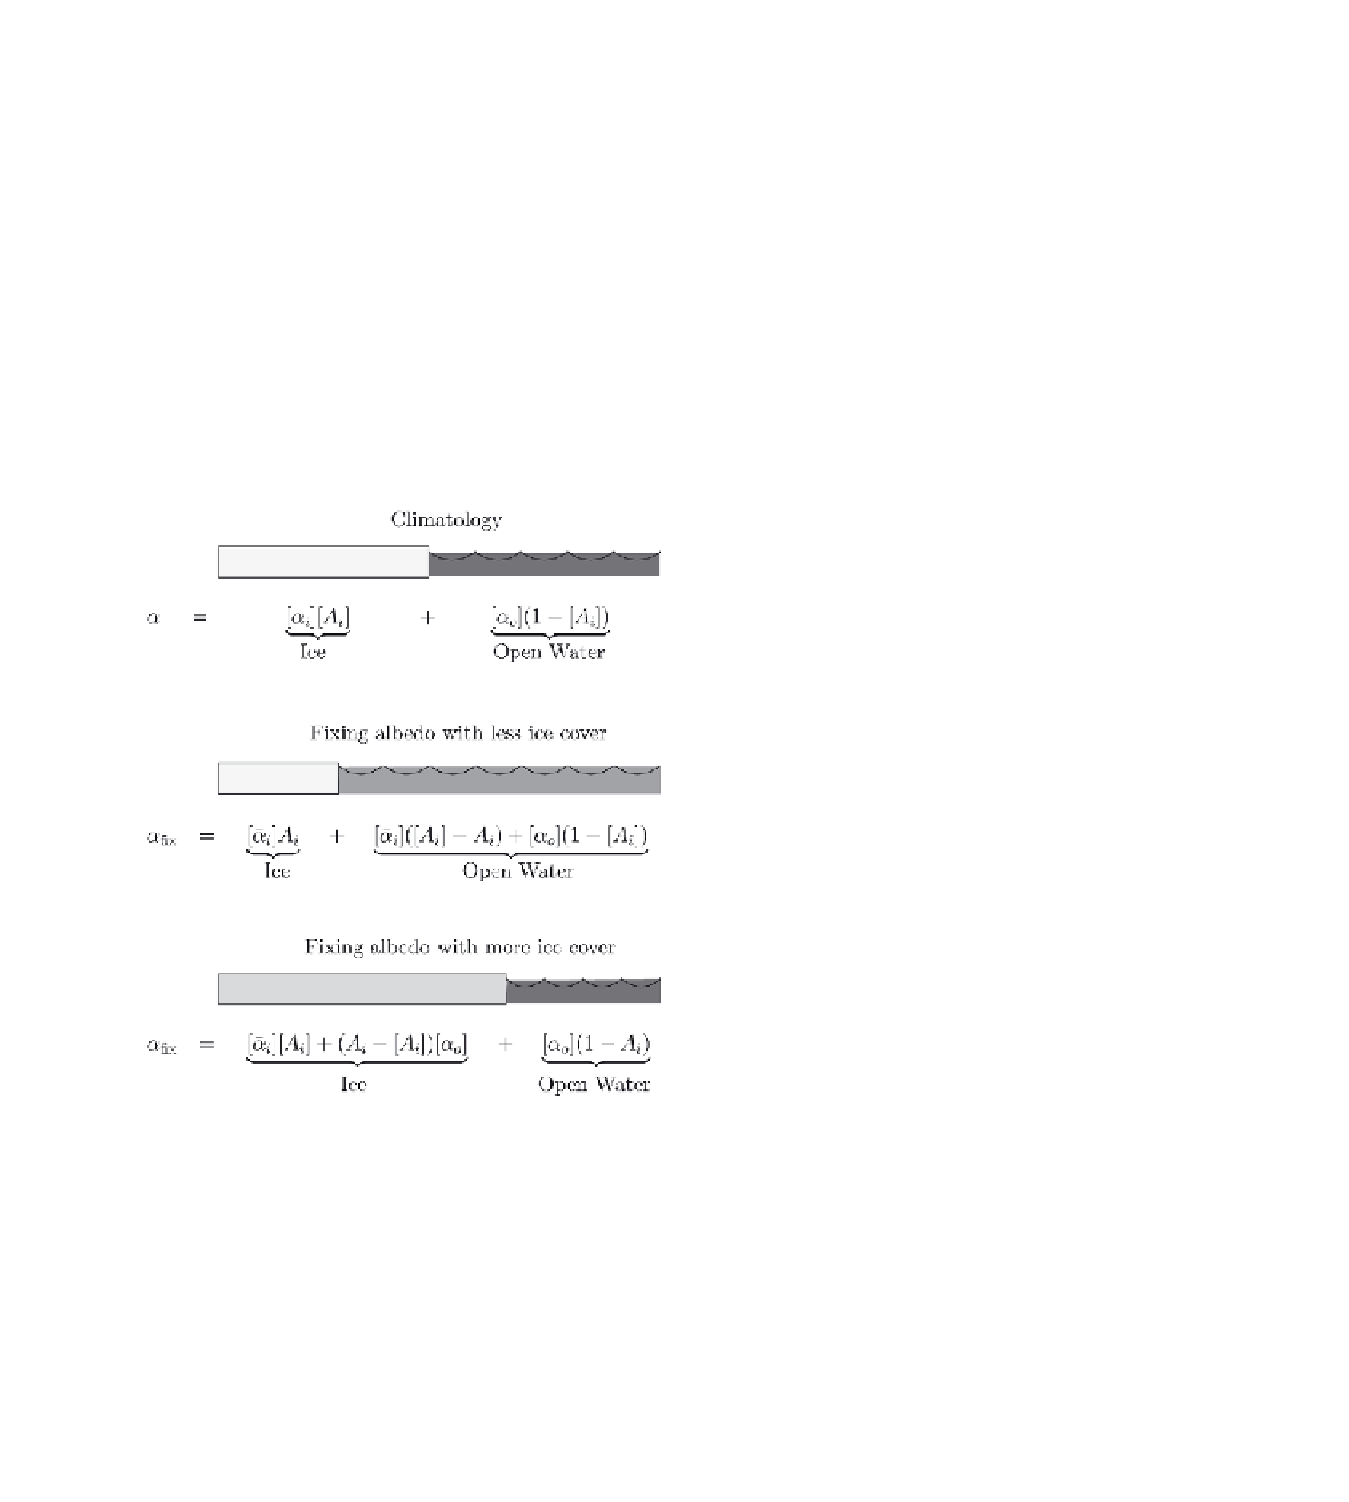
Figure 1.
Illustration of how the grid cell average albedo is fixed in
a run with evolving ice fraction. The shading of the ice and ocean
in the illustration is meant to crudely indicate the relative reflectiv-
ity. If the ice-covered portion of a grid cell in a run with the albedo
fixed should fall below (rise above) the climatological ice fraction,
the albedo of the open water (ice covered) portion is increased
(decreased) to compensate. For simplicity, the ice-thickness dis-
tribution is represented by a single rectangle to indicate the total
ice-covered fraction of the grid cell.
Search WWH ::

Custom Search