Geoscience Reference
In-Depth Information
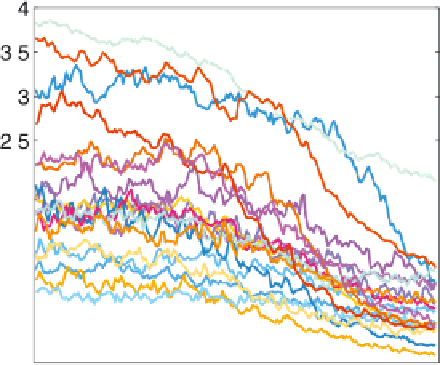
Plate 1
(a) Time series of mean ice thickness north of 70°N in CMIP3 models for the 20th century and SRES A1B future
scenario. (b) Scatterplot of the thickness trend from 2010 to 2050 versus the mean from 1950 to 2000. The numbers corre-
sponds to the order the models are listed in Table 1. The IAB FGOALS model was excluded because it has more than 10
m thick ice in the Arctic in the 20th century, and the IPSL CM4 model was excluded because the run archived at CMIP3
had an erroneous discontinuity in the aerosol forcing (S. Denvil, personal communication, 2008).


Search WWH ::

Custom Search