Geoscience Reference
In-Depth Information
plex interactions between the sea ice and clouds. In this sec-
tion we discuss separately cloud effects on the surface SW
and L W radiative fluxes using ground-based observations
obtained during the year of the SHEBA program
[Intrieri et
aI.,
2002a, 2002b;
Persson et al.,
2002].
The annual mean SW cloud forcing with respect to the
net flux is -10 ± 0.5 W m-2; that is, clouds decrease the net
SW flux by about 10 W m-2• The annual mean L W cloud
forcing with respect to the net flux is 38 ± 3 W m-2
[Intrieri
et aI.,
2002a]. However, cloud radiative forcing has a strong
seasonal vriability. Vriations in the cloud effects on the
net SW flux at the surface depend on cloud transmittance,
the solar zenith angle (insolation), and also on the surface
albedo. The cloud effect on the net L W flux at the surface
is dominated by the downwelling component, which is de-
pendent on cloud properties, such as cloud base temperature,
cloud liquid and ice content, and cloud particle radius. Clas-
sical definition of cloud radiative forcing as a function of
cloud presence (cloudy versus clear sy) or cloud raction is
insufficient in the Arctic, where a wide range of cloud radia-
tive forcing exists for the same cloud fraction.
At SHEBA location (74°-81 ON) polar night lasts from
November to Februry. The effect of cloud on the net SW
0.9
sfc min
0.2
0.1
o---------------+
o
4
0
60
20
80
100
Sea ice concentration,
%
Figure 2.
Monthly mean top-of-atmosphere (TOA) albedo (grey
dots) against Arctic sea ice concenration (SIC). Black dots con-
nected by a line represent area-weighted TOA albedo averages for
0% and 100% SIC, as well as for each 10% SIC bin bsed on all
data regardless of season from the grid boxes where sea ice was
present for at least 1 month during the ERBE time period (Novem-
ber 1984 to February 1990). The dashed lines are standard devia-
tions. The upper thick solid line represents the averages for winter
(December-February); the lower thick solid line represents aver-
ages for summer (June-August). The thin lines denoted by "sfc
max" and "sfc min" connect maximum and minimum observed
surface albedo values for the open ocean and sea ice, showing the
TOA albedo envelope during clear skies.
500--�--���-=�==�
-
Downwelling
-Reflected
""Sea ice RE
400
mean sea ice induce noticeable changes in the TOA albedo,
yet much smaller than the associated changes in the surface
albedo because of the compensating effect of clouds.
�
200
�
-
100
3.2.
Cloud Properties and Surface Radiative Forcing
o-----�
Jan
In the previous section we showed that the sea ice effect
on the top-of-atmosphere albedo is strongly compensated by
clouds. Thus, changes in cloud shortwave radiative forcing
should be taken into account when calculating the magni-
tude of the ice-albedo feedback. In
n,
the effect of clouds
on the SW flux absorbed at the surface (net SW radiation
defined as the difference between the incoming and reflected
SW fluxes at the surface) depends on the surface albedo: for
the sme cloud albedo, the cloud radiative forcing is reater
over the surface with a smaller albedo, while over the highly
reflective surface, clouds have little effect on the surface net
SW flux. In addition, clouds have a warming effect on the
surface by increasing the downwelling L W radiation. Thus,
the surface radiative budget is strongly influenced by
COill-
Mar
May
Jul
Sep
Nov
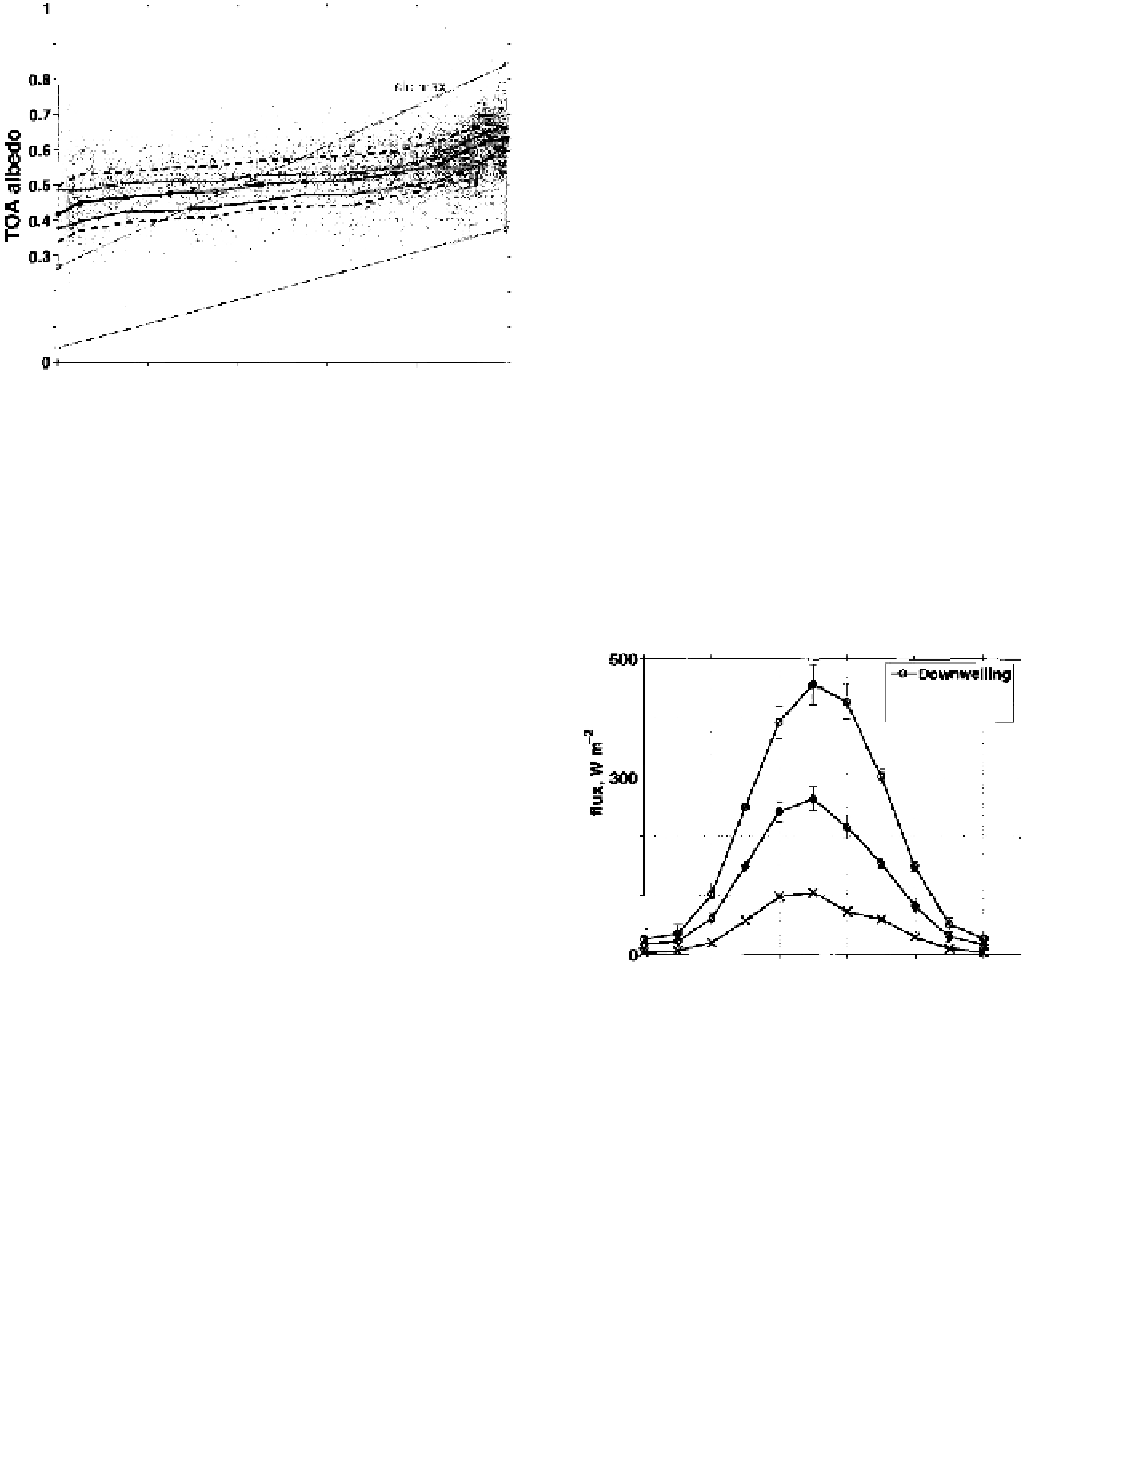
Figure 3.
Seasonal cycles of the top-of-atmosphere (TOA) down-
welling shortwave (SW) radiative flux, reflected SW radiative flux
(both averaged over the ocean north of 700N), and sea ice radiative
effectiveness
(E)
with respect to the SW flux, calculated as the
product of the downwelling SW flux averaged over the ocean area
north of 700N by the sea ice
E
with respect to the TOA albedo
for each month, defined as the difference between the TOA albedo
averaged over 100% and 0% sea ice concentration. Monthly sea
ice
E
with respect to the TOA albedo are 0.10, 0.13, and 0.18 for
December, January, and February; 0.19, 0.23, and 0.25 for March,
April, and May; 0.23, 0.17, and 0.20 for June, July, and August;
and 0.20, 0.20, and 0.15 for September, October, and November
[Gorodetskaya et a.,
2006].


Search WWH ::

Custom Search