Geoscience Reference
In-Depth Information
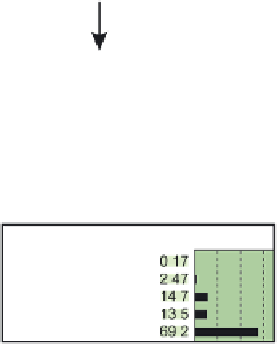
Plate 7.
A subset of the Bayesian network model (Plate 3) illustrating why sea ice conditions projected for year 50 and
beyond have such dire consequences for polar bears of the PBDE. Values of nodes N, C, and B are specified by the GCM
outputs (see Tables D1a and D1b). Shown here are the input categories from the sea ice models projecting the smallest
retreats of sea ice by mid century. Nodes D, F2, C3, and D1 are calculated by the Bayesian network model according to
conditional probabilities specified in Appendix B. For illustration of the influence of sea ice on outcomes, we show future
inputs only for the subset of nodes dealing with sea ice values here; therefore, outcomes shown here differ from those
in Table 2. As illustrated in Table 2, results are more negative when other GCM outputs are used and when time frames
farther into the future are examined.


Search WWH ::

Custom Search