Geoscience Reference
In-Depth Information
Figure 7.
Simulated average rate of sea ice melt over the central Arctic basin for ccSm3 control simulation years 485,
489, 490, and 491, and for the long-term average, in cm d
-1
. error bars denote the standard deviation over the period
250-599.
A dramatic picture of conditions in simulation year 490
is seen in Figure 8, which shows the summertime near-sur-
face air temperature anomalies. While air temperatures are
likely restricted by the presence of sea ice and cold water
temperatures in the central Arctic, values greater than 3°c
of early melt implies that sea ice growth in the Arctic ended
earlier in the preceding winter. These conditions of an early
spring, which occurred in the presence of declining sea ice
volume, appear to have prompted the remarkable September
sea ice extent minimum in the simulation.
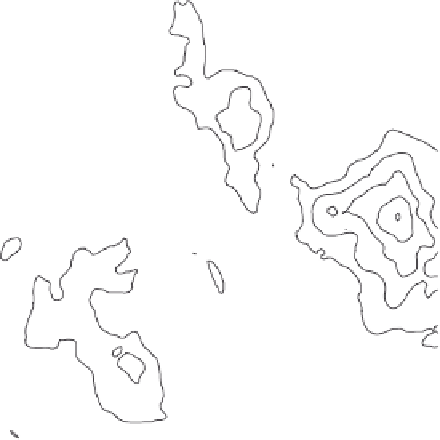
Figure 8.
Stevenson screen reference height air temperature anomaly from the CCSM control simulation for model years
(left) 489 and (right) 490, averaged for the months of may through September. The contour interval is 1°c. Hatched areas
denote significance at the 95th percentile.


Search WWH ::

Custom Search